Alsatian vs Immigrants from Sudan 5th Grade
COMPARE
Alsatian
Immigrants from Sudan
5th Grade
5th Grade Comparison
Alsatians
Immigrants from Sudan
97.4%
5TH GRADE
74.3/ 100
METRIC RATING
153rd/ 347
METRIC RANK
97.1%
5TH GRADE
6.5/ 100
METRIC RATING
218th/ 347
METRIC RANK
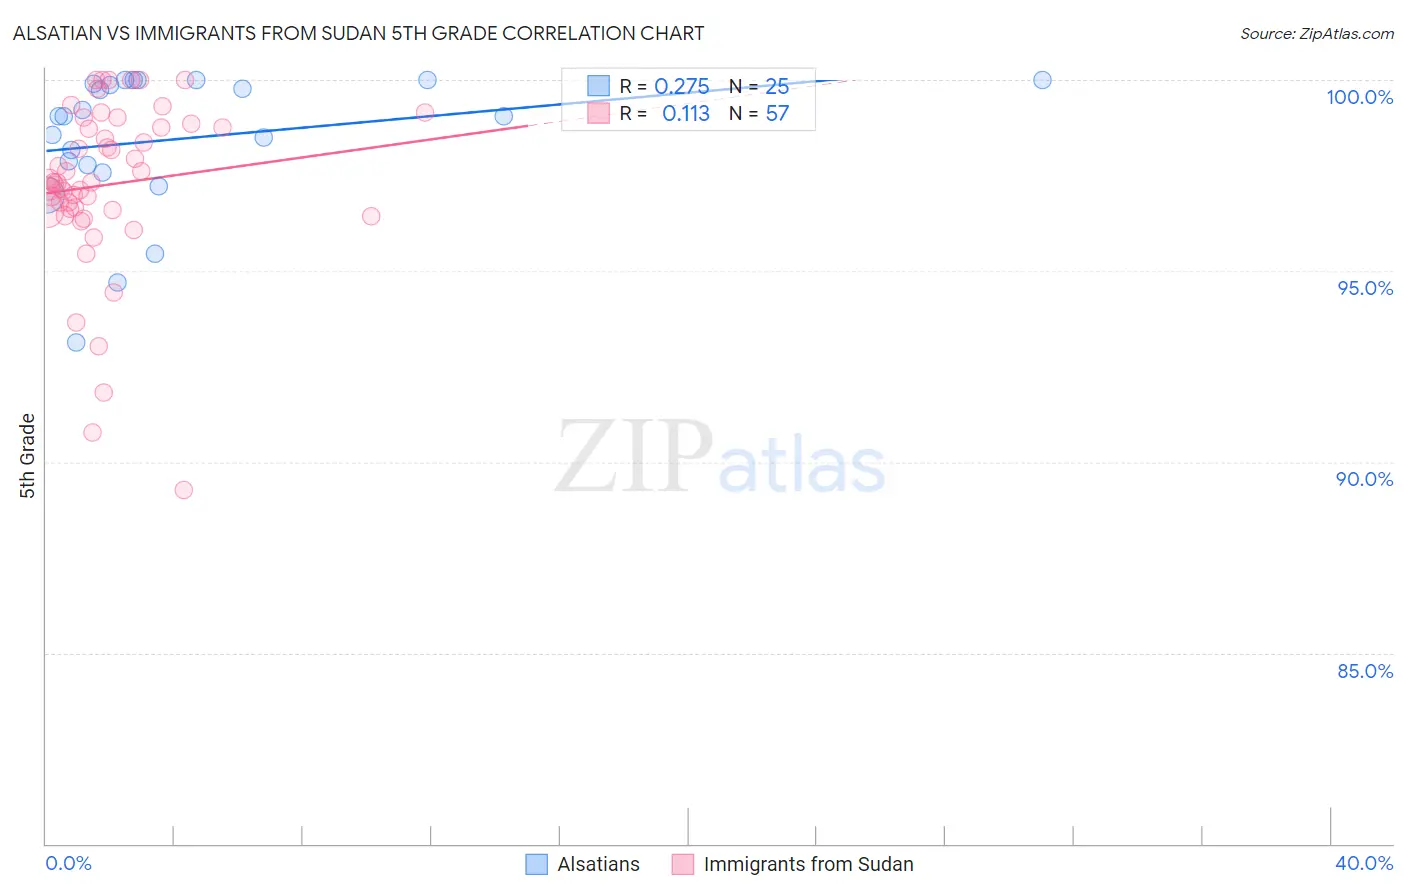
Alsatian vs Immigrants from Sudan 5th Grade Correlation Chart
The statistical analysis conducted on geographies consisting of 82,682,365 people shows a weak positive correlation between the proportion of Alsatians and percentage of population with at least 5th grade education in the United States with a correlation coefficient (R) of 0.275 and weighted average of 97.4%. Similarly, the statistical analysis conducted on geographies consisting of 118,959,807 people shows a poor positive correlation between the proportion of Immigrants from Sudan and percentage of population with at least 5th grade education in the United States with a correlation coefficient (R) of 0.113 and weighted average of 97.1%, a difference of 0.39%.
5th Grade Correlation Summary
| Measurement | Alsatian | Immigrants from Sudan |
| Minimum | 93.1% | 89.3% |
| Maximum | 100.0% | 100.0% |
| Range | 6.9% | 10.7% |
| Mean | 98.5% | 97.3% |
| Median | 99.0% | 97.3% |
| Interquartile 25% (IQ1) | 97.7% | 96.6% |
| Interquartile 75% (IQ3) | 100.0% | 98.8% |
| Interquartile Range (IQR) | 2.3% | 2.2% |
| Standard Deviation (Sample) | 1.8% | 2.2% |
| Standard Deviation (Population) | 1.8% | 2.2% |
Similar Demographics by 5th Grade
Demographics Similar to Alsatians by 5th Grade
In terms of 5th grade, the demographic groups most similar to Alsatians are Immigrants from Eastern Europe (97.4%, a difference of 0.0%), Ute (97.4%, a difference of 0.0%), Immigrants from South Central Asia (97.5%, a difference of 0.020%), Immigrants from Russia (97.4%, a difference of 0.020%), and Immigrants from Bosnia and Herzegovina (97.4%, a difference of 0.020%).
| Demographics | Rating | Rank | 5th Grade |
| Spaniards | 81.9 /100 | #146 | Excellent 97.5% |
| Soviet Union | 81.2 /100 | #147 | Excellent 97.5% |
| Immigrants | Israel | 79.1 /100 | #148 | Good 97.5% |
| Hopi | 78.6 /100 | #149 | Good 97.5% |
| Immigrants | South Central Asia | 78.6 /100 | #150 | Good 97.5% |
| Immigrants | Eastern Europe | 75.0 /100 | #151 | Good 97.4% |
| Ute | 74.9 /100 | #152 | Good 97.4% |
| Alsatians | 74.3 /100 | #153 | Good 97.4% |
| Immigrants | Russia | 71.2 /100 | #154 | Good 97.4% |
| Immigrants | Bosnia and Herzegovina | 71.0 /100 | #155 | Good 97.4% |
| French American Indians | 70.5 /100 | #156 | Good 97.4% |
| Immigrants | Jordan | 70.4 /100 | #157 | Good 97.4% |
| Albanians | 68.3 /100 | #158 | Good 97.4% |
| Immigrants | Italy | 65.2 /100 | #159 | Good 97.4% |
| Marshallese | 61.2 /100 | #160 | Good 97.4% |
Demographics Similar to Immigrants from Sudan by 5th Grade
In terms of 5th grade, the demographic groups most similar to Immigrants from Sudan are Immigrants from Lebanon (97.1%, a difference of 0.0%), Immigrants from Syria (97.1%, a difference of 0.0%), Immigrants from Southern Europe (97.1%, a difference of 0.0%), Immigrants from Morocco (97.1%, a difference of 0.010%), and Sudanese (97.1%, a difference of 0.010%).
| Demographics | Rating | Rank | 5th Grade |
| Samoans | 8.5 /100 | #211 | Tragic 97.1% |
| Immigrants | Iraq | 8.3 /100 | #212 | Tragic 97.1% |
| Portuguese | 7.8 /100 | #213 | Tragic 97.1% |
| Costa Ricans | 7.7 /100 | #214 | Tragic 97.1% |
| Immigrants | Morocco | 7.5 /100 | #215 | Tragic 97.1% |
| Sudanese | 7.0 /100 | #216 | Tragic 97.1% |
| Immigrants | Lebanon | 6.8 /100 | #217 | Tragic 97.1% |
| Immigrants | Sudan | 6.5 /100 | #218 | Tragic 97.1% |
| Immigrants | Syria | 6.4 /100 | #219 | Tragic 97.1% |
| Immigrants | Southern Europe | 6.3 /100 | #220 | Tragic 97.1% |
| Sierra Leoneans | 6.0 /100 | #221 | Tragic 97.1% |
| Immigrants | Panama | 5.7 /100 | #222 | Tragic 97.0% |
| Liberians | 5.7 /100 | #223 | Tragic 97.0% |
| South American Indians | 5.4 /100 | #224 | Tragic 97.0% |
| Bahamians | 5.3 /100 | #225 | Tragic 97.0% |