Alsatian vs Immigrants from Sudan Poverty
COMPARE
Alsatian
Immigrants from Sudan
Poverty
Poverty Comparison
Alsatians
Immigrants from Sudan
13.4%
POVERTY
2.6/ 100
METRIC RATING
221st/ 347
METRIC RANK
14.1%
POVERTY
0.3/ 100
METRIC RATING
245th/ 347
METRIC RANK
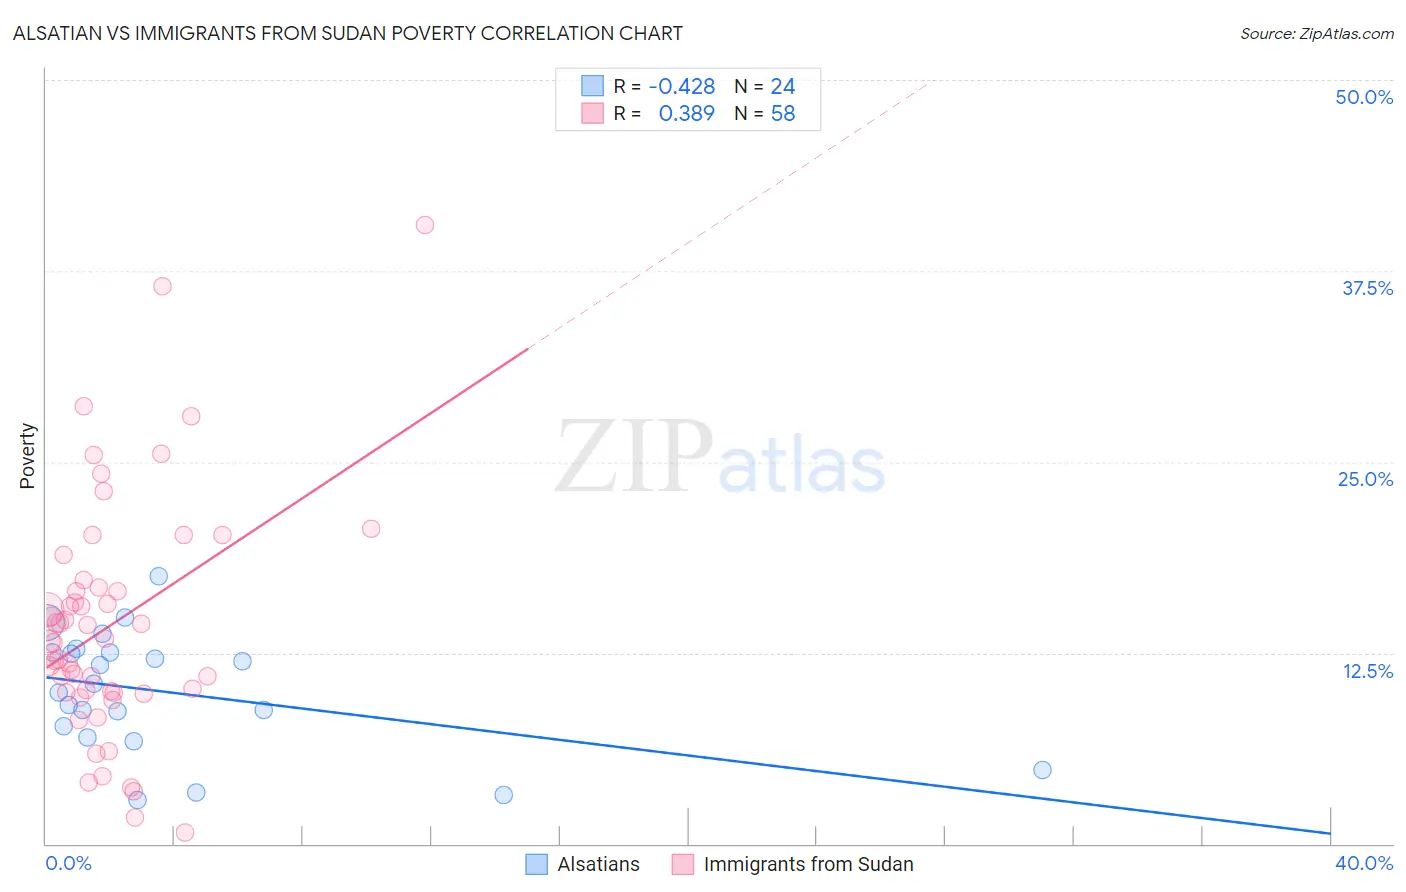
Alsatian vs Immigrants from Sudan Poverty Correlation Chart
The statistical analysis conducted on geographies consisting of 82,679,902 people shows a moderate negative correlation between the proportion of Alsatians and poverty level in the United States with a correlation coefficient (R) of -0.428 and weighted average of 13.4%. Similarly, the statistical analysis conducted on geographies consisting of 118,962,035 people shows a mild positive correlation between the proportion of Immigrants from Sudan and poverty level in the United States with a correlation coefficient (R) of 0.389 and weighted average of 14.1%, a difference of 5.1%.
Poverty Correlation Summary
| Measurement | Alsatian | Immigrants from Sudan |
| Minimum | 2.9% | 0.75% |
| Maximum | 17.5% | 40.5% |
| Range | 14.6% | 39.8% |
| Mean | 9.9% | 14.3% |
| Median | 10.2% | 13.4% |
| Interquartile 25% (IQ1) | 7.3% | 9.9% |
| Interquartile 75% (IQ3) | 12.5% | 16.8% |
| Interquartile Range (IQR) | 5.2% | 6.9% |
| Standard Deviation (Sample) | 3.9% | 7.8% |
| Standard Deviation (Population) | 3.8% | 7.7% |
Similar Demographics by Poverty
Demographics Similar to Alsatians by Poverty
In terms of poverty, the demographic groups most similar to Alsatians are Immigrants from Micronesia (13.4%, a difference of 0.040%), Immigrants from Africa (13.4%, a difference of 0.080%), Immigrants from Eritrea (13.4%, a difference of 0.18%), American (13.4%, a difference of 0.20%), and Immigrants from Cambodia (13.4%, a difference of 0.29%).
| Demographics | Rating | Rank | Poverty |
| Bermudans | 3.7 /100 | #214 | Tragic 13.3% |
| Japanese | 3.3 /100 | #215 | Tragic 13.3% |
| Immigrants | Nonimmigrants | 3.3 /100 | #216 | Tragic 13.3% |
| Immigrants | Uzbekistan | 3.2 /100 | #217 | Tragic 13.3% |
| Immigrants | Thailand | 3.1 /100 | #218 | Tragic 13.3% |
| Immigrants | Cambodia | 3.0 /100 | #219 | Tragic 13.4% |
| Americans | 2.9 /100 | #220 | Tragic 13.4% |
| Alsatians | 2.6 /100 | #221 | Tragic 13.4% |
| Immigrants | Micronesia | 2.6 /100 | #222 | Tragic 13.4% |
| Immigrants | Africa | 2.5 /100 | #223 | Tragic 13.4% |
| Immigrants | Eritrea | 2.4 /100 | #224 | Tragic 13.4% |
| German Russians | 2.2 /100 | #225 | Tragic 13.4% |
| Marshallese | 2.2 /100 | #226 | Tragic 13.4% |
| Alaska Natives | 2.1 /100 | #227 | Tragic 13.5% |
| Immigrants | Nigeria | 1.7 /100 | #228 | Tragic 13.5% |
Demographics Similar to Immigrants from Sudan by Poverty
In terms of poverty, the demographic groups most similar to Immigrants from Sudan are Potawatomi (14.1%, a difference of 0.20%), Nepalese (14.0%, a difference of 0.39%), Sudanese (14.0%, a difference of 0.42%), Liberian (14.1%, a difference of 0.48%), and Ecuadorian (14.0%, a difference of 0.49%).
| Demographics | Rating | Rank | Poverty |
| Ghanaians | 0.5 /100 | #238 | Tragic 13.9% |
| Nicaraguans | 0.4 /100 | #239 | Tragic 13.9% |
| Immigrants | Middle Africa | 0.4 /100 | #240 | Tragic 14.0% |
| Salvadorans | 0.4 /100 | #241 | Tragic 14.0% |
| Ecuadorians | 0.4 /100 | #242 | Tragic 14.0% |
| Sudanese | 0.3 /100 | #243 | Tragic 14.0% |
| Nepalese | 0.3 /100 | #244 | Tragic 14.0% |
| Immigrants | Sudan | 0.3 /100 | #245 | Tragic 14.1% |
| Potawatomi | 0.3 /100 | #246 | Tragic 14.1% |
| Liberians | 0.2 /100 | #247 | Tragic 14.1% |
| Immigrants | Western Africa | 0.2 /100 | #248 | Tragic 14.1% |
| Immigrants | Ghana | 0.2 /100 | #249 | Tragic 14.2% |
| Cree | 0.2 /100 | #250 | Tragic 14.2% |
| Immigrants | Burma/Myanmar | 0.2 /100 | #251 | Tragic 14.2% |
| Spanish American Indians | 0.2 /100 | #252 | Tragic 14.2% |