Aleut vs Osage Bachelor's Degree
COMPARE
Aleut
Osage
Bachelor's Degree
Bachelor's Degree Comparison
Aleuts
Osage
31.3%
BACHELOR'S DEGREE
0.1/ 100
METRIC RATING
285th/ 347
METRIC RANK
33.0%
BACHELOR'S DEGREE
0.5/ 100
METRIC RATING
259th/ 347
METRIC RANK
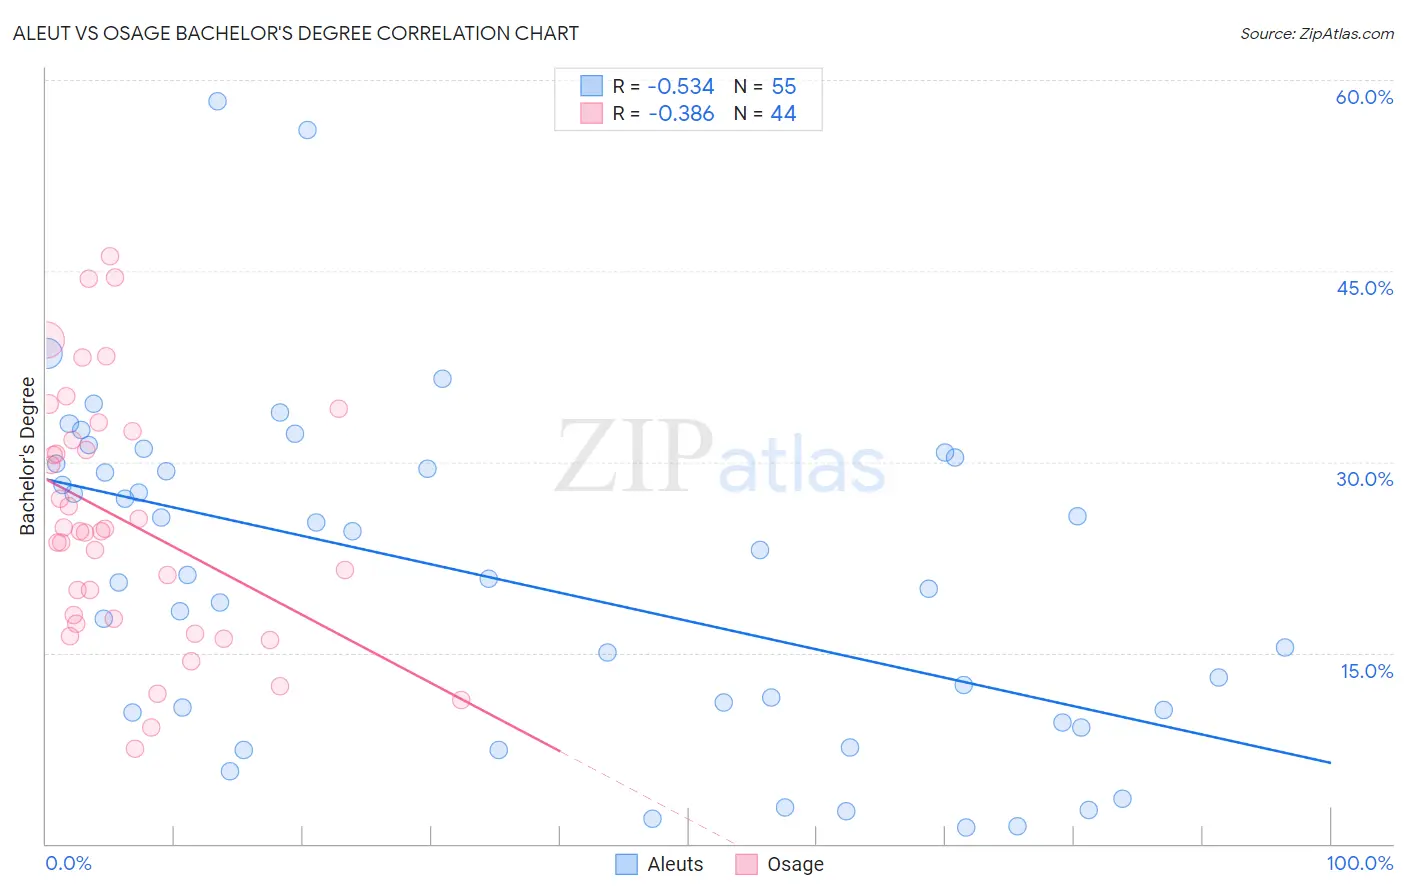
Aleut vs Osage Bachelor's Degree Correlation Chart
The statistical analysis conducted on geographies consisting of 61,782,473 people shows a substantial negative correlation between the proportion of Aleuts and percentage of population with at least bachelor's degree education in the United States with a correlation coefficient (R) of -0.534 and weighted average of 31.3%. Similarly, the statistical analysis conducted on geographies consisting of 91,806,618 people shows a mild negative correlation between the proportion of Osage and percentage of population with at least bachelor's degree education in the United States with a correlation coefficient (R) of -0.386 and weighted average of 33.0%, a difference of 5.5%.
Bachelor's Degree Correlation Summary
| Measurement | Aleut | Osage |
| Minimum | 1.3% | 7.5% |
| Maximum | 58.3% | 46.2% |
| Range | 57.1% | 38.7% |
| Mean | 20.8% | 25.3% |
| Median | 20.9% | 24.5% |
| Interquartile 25% (IQ1) | 10.3% | 17.5% |
| Interquartile 75% (IQ3) | 29.9% | 32.0% |
| Interquartile Range (IQR) | 19.5% | 14.6% |
| Standard Deviation (Sample) | 13.0% | 9.7% |
| Standard Deviation (Population) | 12.9% | 9.6% |
Similar Demographics by Bachelor's Degree
Demographics Similar to Aleuts by Bachelor's Degree
In terms of bachelor's degree, the demographic groups most similar to Aleuts are Haitian (31.3%, a difference of 0.010%), Honduran (31.3%, a difference of 0.040%), Immigrants from El Salvador (31.3%, a difference of 0.050%), Immigrants from Caribbean (31.4%, a difference of 0.32%), and Blackfeet (31.5%, a difference of 0.47%).
| Demographics | Rating | Rank | Bachelor's Degree |
| Marshallese | 0.1 /100 | #278 | Tragic 31.7% |
| Hawaiians | 0.1 /100 | #279 | Tragic 31.6% |
| Immigrants | Laos | 0.1 /100 | #280 | Tragic 31.6% |
| Blackfeet | 0.1 /100 | #281 | Tragic 31.5% |
| Immigrants | Caribbean | 0.1 /100 | #282 | Tragic 31.4% |
| Hondurans | 0.1 /100 | #283 | Tragic 31.3% |
| Haitians | 0.1 /100 | #284 | Tragic 31.3% |
| Aleuts | 0.1 /100 | #285 | Tragic 31.3% |
| Immigrants | El Salvador | 0.1 /100 | #286 | Tragic 31.3% |
| Ottawa | 0.1 /100 | #287 | Tragic 31.1% |
| Guatemalans | 0.1 /100 | #288 | Tragic 31.0% |
| Puerto Ricans | 0.1 /100 | #289 | Tragic 31.0% |
| Immigrants | Honduras | 0.1 /100 | #290 | Tragic 30.9% |
| Blacks/African Americans | 0.1 /100 | #291 | Tragic 30.9% |
| Ute | 0.1 /100 | #292 | Tragic 30.9% |
Demographics Similar to Osage by Bachelor's Degree
In terms of bachelor's degree, the demographic groups most similar to Osage are French American Indian (33.1%, a difference of 0.050%), Spanish American (33.1%, a difference of 0.090%), Nicaraguan (33.1%, a difference of 0.31%), Malaysian (32.9%, a difference of 0.36%), and African (32.9%, a difference of 0.45%).
| Demographics | Rating | Rank | Bachelor's Degree |
| Immigrants | Bahamas | 0.7 /100 | #252 | Tragic 33.3% |
| U.S. Virgin Islanders | 0.7 /100 | #253 | Tragic 33.2% |
| Native Hawaiians | 0.7 /100 | #254 | Tragic 33.2% |
| Iroquois | 0.7 /100 | #255 | Tragic 33.2% |
| Nicaraguans | 0.6 /100 | #256 | Tragic 33.1% |
| Spanish Americans | 0.6 /100 | #257 | Tragic 33.1% |
| French American Indians | 0.6 /100 | #258 | Tragic 33.1% |
| Osage | 0.5 /100 | #259 | Tragic 33.0% |
| Malaysians | 0.5 /100 | #260 | Tragic 32.9% |
| Africans | 0.5 /100 | #261 | Tragic 32.9% |
| Immigrants | Jamaica | 0.5 /100 | #262 | Tragic 32.9% |
| Belizeans | 0.4 /100 | #263 | Tragic 32.8% |
| Central American Indians | 0.3 /100 | #264 | Tragic 32.5% |
| Bahamians | 0.3 /100 | #265 | Tragic 32.5% |
| Immigrants | Dominica | 0.3 /100 | #266 | Tragic 32.5% |