Aleut vs Immigrants from Netherlands Median Household Income
COMPARE
Aleut
Immigrants from Netherlands
Median Household Income
Median Household Income Comparison
Aleuts
Immigrants from Netherlands
$83,446
MEDIAN HOUSEHOLD INCOME
25.7/ 100
METRIC RATING
197th/ 347
METRIC RANK
$94,411
MEDIAN HOUSEHOLD INCOME
99.7/ 100
METRIC RATING
64th/ 347
METRIC RANK
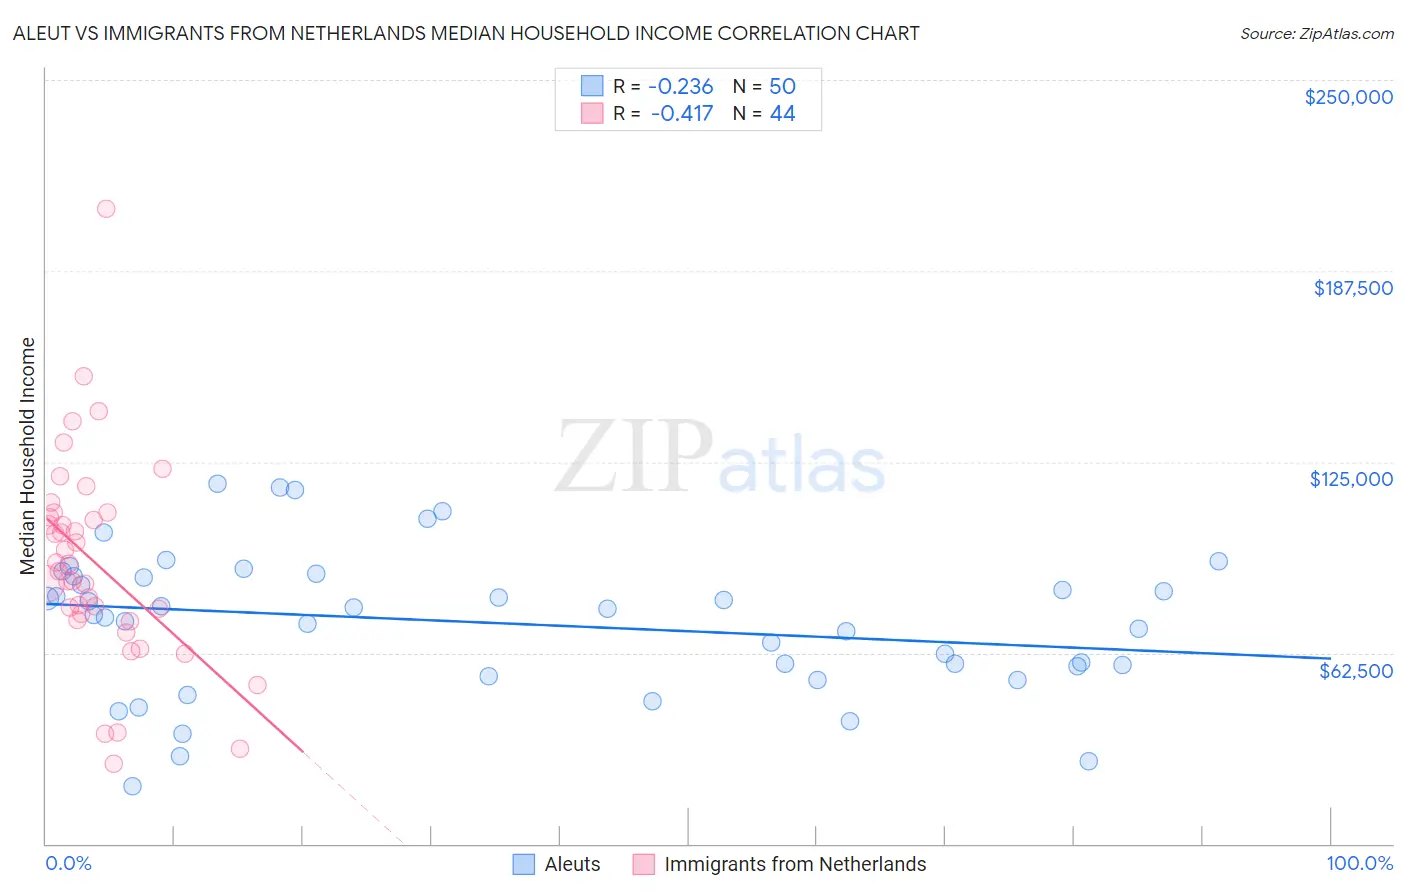
Aleut vs Immigrants from Netherlands Median Household Income Correlation Chart
The statistical analysis conducted on geographies consisting of 61,772,916 people shows a weak negative correlation between the proportion of Aleuts and median household income in the United States with a correlation coefficient (R) of -0.236 and weighted average of $83,446. Similarly, the statistical analysis conducted on geographies consisting of 237,766,506 people shows a moderate negative correlation between the proportion of Immigrants from Netherlands and median household income in the United States with a correlation coefficient (R) of -0.417 and weighted average of $94,411, a difference of 13.1%.
Median Household Income Correlation Summary
| Measurement | Aleut | Immigrants from Netherlands |
| Minimum | $18,750 | $26,321 |
| Maximum | $117,969 | $207,847 |
| Range | $99,219 | $181,526 |
| Mean | $72,433 | $92,018 |
| Median | $75,755 | $90,410 |
| Interquartile 25% (IQ1) | $58,000 | $74,172 |
| Interquartile 75% (IQ3) | $87,683 | $107,615 |
| Interquartile Range (IQR) | $29,683 | $33,443 |
| Standard Deviation (Sample) | $23,307 | $33,648 |
| Standard Deviation (Population) | $23,073 | $33,264 |
Similar Demographics by Median Household Income
Demographics Similar to Aleuts by Median Household Income
In terms of median household income, the demographic groups most similar to Aleuts are French ($83,468, a difference of 0.030%), Japanese ($83,395, a difference of 0.060%), German ($83,358, a difference of 0.11%), Tsimshian ($83,346, a difference of 0.12%), and Spanish ($83,343, a difference of 0.12%).
| Demographics | Rating | Rank | Median Household Income |
| Slovaks | 30.2 /100 | #190 | Fair $83,798 |
| Iraqis | 29.6 /100 | #191 | Fair $83,753 |
| Welsh | 28.0 /100 | #192 | Fair $83,628 |
| Finns | 27.7 /100 | #193 | Fair $83,607 |
| Ghanaians | 27.4 /100 | #194 | Fair $83,582 |
| Immigrants | Armenia | 27.0 /100 | #195 | Fair $83,555 |
| French | 26.0 /100 | #196 | Fair $83,468 |
| Aleuts | 25.7 /100 | #197 | Fair $83,446 |
| Japanese | 25.1 /100 | #198 | Fair $83,395 |
| Germans | 24.6 /100 | #199 | Fair $83,358 |
| Tsimshian | 24.5 /100 | #200 | Fair $83,346 |
| Spanish | 24.4 /100 | #201 | Fair $83,343 |
| Immigrants | Thailand | 24.3 /100 | #202 | Fair $83,327 |
| Immigrants | Cambodia | 24.0 /100 | #203 | Fair $83,304 |
| Immigrants | Africa | 23.8 /100 | #204 | Fair $83,289 |
Demographics Similar to Immigrants from Netherlands by Median Household Income
In terms of median household income, the demographic groups most similar to Immigrants from Netherlands are Immigrants from Belarus ($94,399, a difference of 0.010%), Immigrants from Romania ($94,222, a difference of 0.20%), Greek ($94,735, a difference of 0.34%), Immigrants from Scotland ($94,091, a difference of 0.34%), and Immigrants from Norway ($94,846, a difference of 0.46%).
| Demographics | Rating | Rank | Median Household Income |
| New Zealanders | 99.8 /100 | #57 | Exceptional $95,146 |
| Soviet Union | 99.8 /100 | #58 | Exceptional $95,098 |
| Immigrants | Europe | 99.8 /100 | #59 | Exceptional $95,032 |
| Koreans | 99.8 /100 | #60 | Exceptional $95,018 |
| Laotians | 99.8 /100 | #61 | Exceptional $94,990 |
| Immigrants | Norway | 99.8 /100 | #62 | Exceptional $94,846 |
| Greeks | 99.8 /100 | #63 | Exceptional $94,735 |
| Immigrants | Netherlands | 99.7 /100 | #64 | Exceptional $94,411 |
| Immigrants | Belarus | 99.7 /100 | #65 | Exceptional $94,399 |
| Immigrants | Romania | 99.7 /100 | #66 | Exceptional $94,222 |
| Immigrants | Scotland | 99.7 /100 | #67 | Exceptional $94,091 |
| Mongolians | 99.7 /100 | #68 | Exceptional $93,971 |
| Argentineans | 99.7 /100 | #69 | Exceptional $93,960 |
| Immigrants | Fiji | 99.7 /100 | #70 | Exceptional $93,933 |
| Immigrants | Philippines | 99.6 /100 | #71 | Exceptional $93,899 |