Aleut vs Central American Median Household Income
COMPARE
Aleut
Central American
Median Household Income
Median Household Income Comparison
Aleuts
Central Americans
$83,446
MEDIAN HOUSEHOLD INCOME
25.7/ 100
METRIC RATING
197th/ 347
METRIC RANK
$78,803
MEDIAN HOUSEHOLD INCOME
1.7/ 100
METRIC RATING
246th/ 347
METRIC RANK
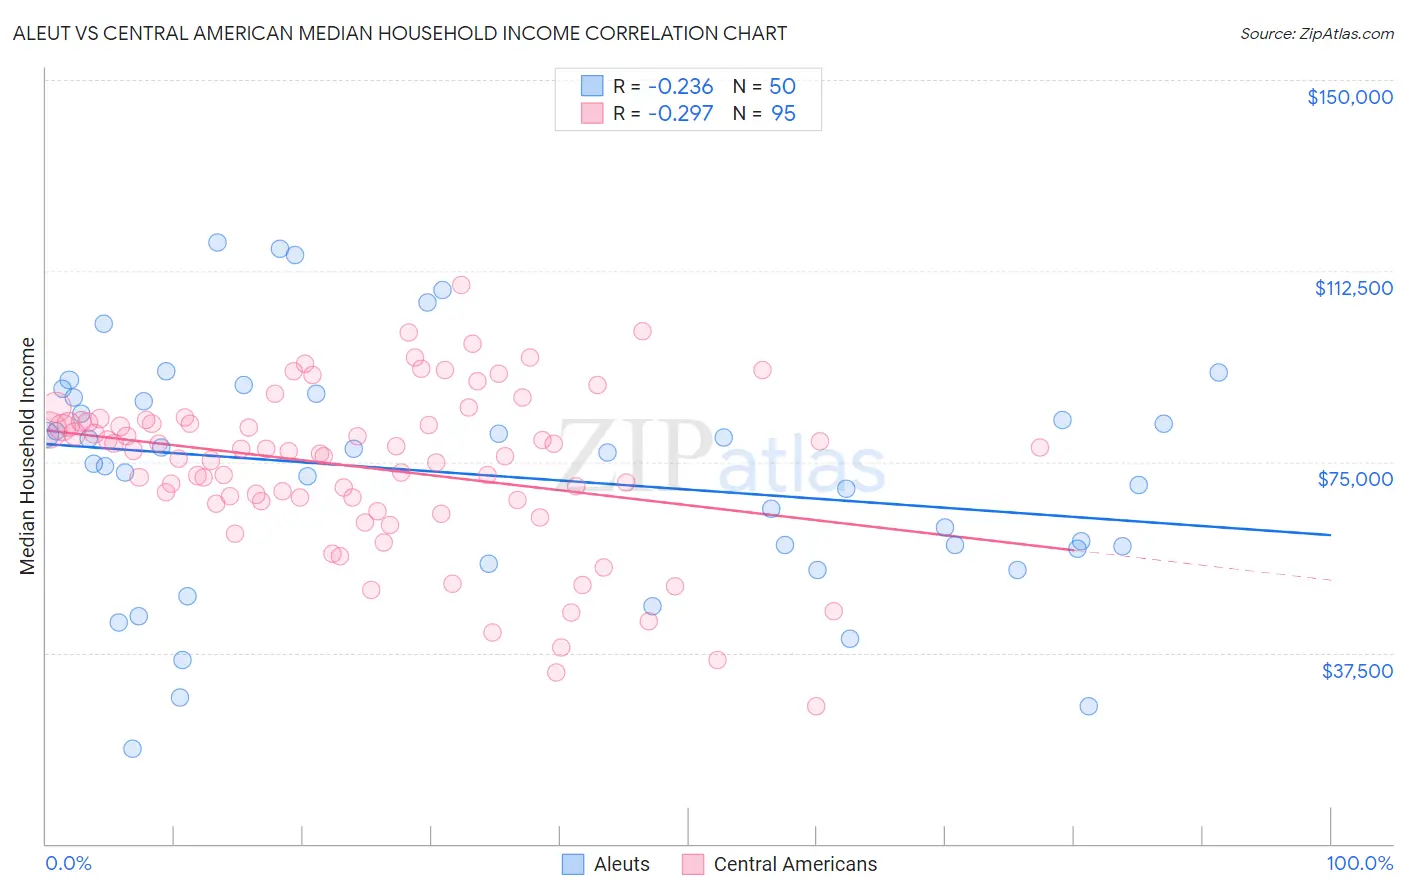
Aleut vs Central American Median Household Income Correlation Chart
The statistical analysis conducted on geographies consisting of 61,772,916 people shows a weak negative correlation between the proportion of Aleuts and median household income in the United States with a correlation coefficient (R) of -0.236 and weighted average of $83,446. Similarly, the statistical analysis conducted on geographies consisting of 503,881,037 people shows a weak negative correlation between the proportion of Central Americans and median household income in the United States with a correlation coefficient (R) of -0.297 and weighted average of $78,803, a difference of 5.9%.
Median Household Income Correlation Summary
| Measurement | Aleut | Central American |
| Minimum | $18,750 | $26,979 |
| Maximum | $117,969 | $109,623 |
| Range | $99,219 | $82,644 |
| Mean | $72,433 | $73,852 |
| Median | $75,755 | $77,087 |
| Interquartile 25% (IQ1) | $58,000 | $67,287 |
| Interquartile 75% (IQ3) | $87,683 | $82,754 |
| Interquartile Range (IQR) | $29,683 | $15,467 |
| Standard Deviation (Sample) | $23,307 | $15,929 |
| Standard Deviation (Population) | $23,073 | $15,845 |
Similar Demographics by Median Household Income
Demographics Similar to Aleuts by Median Household Income
In terms of median household income, the demographic groups most similar to Aleuts are French ($83,468, a difference of 0.030%), Japanese ($83,395, a difference of 0.060%), German ($83,358, a difference of 0.11%), Tsimshian ($83,346, a difference of 0.12%), and Spanish ($83,343, a difference of 0.12%).
| Demographics | Rating | Rank | Median Household Income |
| Slovaks | 30.2 /100 | #190 | Fair $83,798 |
| Iraqis | 29.6 /100 | #191 | Fair $83,753 |
| Welsh | 28.0 /100 | #192 | Fair $83,628 |
| Finns | 27.7 /100 | #193 | Fair $83,607 |
| Ghanaians | 27.4 /100 | #194 | Fair $83,582 |
| Immigrants | Armenia | 27.0 /100 | #195 | Fair $83,555 |
| French | 26.0 /100 | #196 | Fair $83,468 |
| Aleuts | 25.7 /100 | #197 | Fair $83,446 |
| Japanese | 25.1 /100 | #198 | Fair $83,395 |
| Germans | 24.6 /100 | #199 | Fair $83,358 |
| Tsimshian | 24.5 /100 | #200 | Fair $83,346 |
| Spanish | 24.4 /100 | #201 | Fair $83,343 |
| Immigrants | Thailand | 24.3 /100 | #202 | Fair $83,327 |
| Immigrants | Cambodia | 24.0 /100 | #203 | Fair $83,304 |
| Immigrants | Africa | 23.8 /100 | #204 | Fair $83,289 |
Demographics Similar to Central Americans by Median Household Income
In terms of median household income, the demographic groups most similar to Central Americans are Inupiat ($78,841, a difference of 0.050%), Immigrants from Burma/Myanmar ($78,682, a difference of 0.15%), Marshallese ($78,930, a difference of 0.16%), Immigrants from Barbados ($78,989, a difference of 0.24%), and Sudanese ($78,529, a difference of 0.35%).
| Demographics | Rating | Rank | Median Household Income |
| Alaska Natives | 2.7 /100 | #239 | Tragic $79,509 |
| Immigrants | Western Africa | 2.7 /100 | #240 | Tragic $79,490 |
| Immigrants | Nonimmigrants | 2.6 /100 | #241 | Tragic $79,429 |
| Immigrants | Sudan | 2.1 /100 | #242 | Tragic $79,103 |
| Immigrants | Barbados | 1.9 /100 | #243 | Tragic $78,989 |
| Marshallese | 1.9 /100 | #244 | Tragic $78,930 |
| Inupiat | 1.8 /100 | #245 | Tragic $78,841 |
| Central Americans | 1.7 /100 | #246 | Tragic $78,803 |
| Immigrants | Burma/Myanmar | 1.6 /100 | #247 | Tragic $78,682 |
| Sudanese | 1.5 /100 | #248 | Tragic $78,529 |
| West Indians | 1.4 /100 | #249 | Tragic $78,455 |
| Immigrants | Laos | 1.3 /100 | #250 | Tragic $78,327 |
| Mexican American Indians | 1.2 /100 | #251 | Tragic $78,166 |
| Immigrants | West Indies | 1.0 /100 | #252 | Tragic $77,956 |
| Immigrants | St. Vincent and the Grenadines | 0.9 /100 | #253 | Tragic $77,690 |