Spaniard vs Immigrants from Netherlands Median Household Income
COMPARE
Spaniard
Immigrants from Netherlands
Median Household Income
Median Household Income Comparison
Spaniards
Immigrants from Netherlands
$84,644
MEDIAN HOUSEHOLD INCOME
42.7/ 100
METRIC RATING
183rd/ 347
METRIC RANK
$94,411
MEDIAN HOUSEHOLD INCOME
99.7/ 100
METRIC RATING
64th/ 347
METRIC RANK
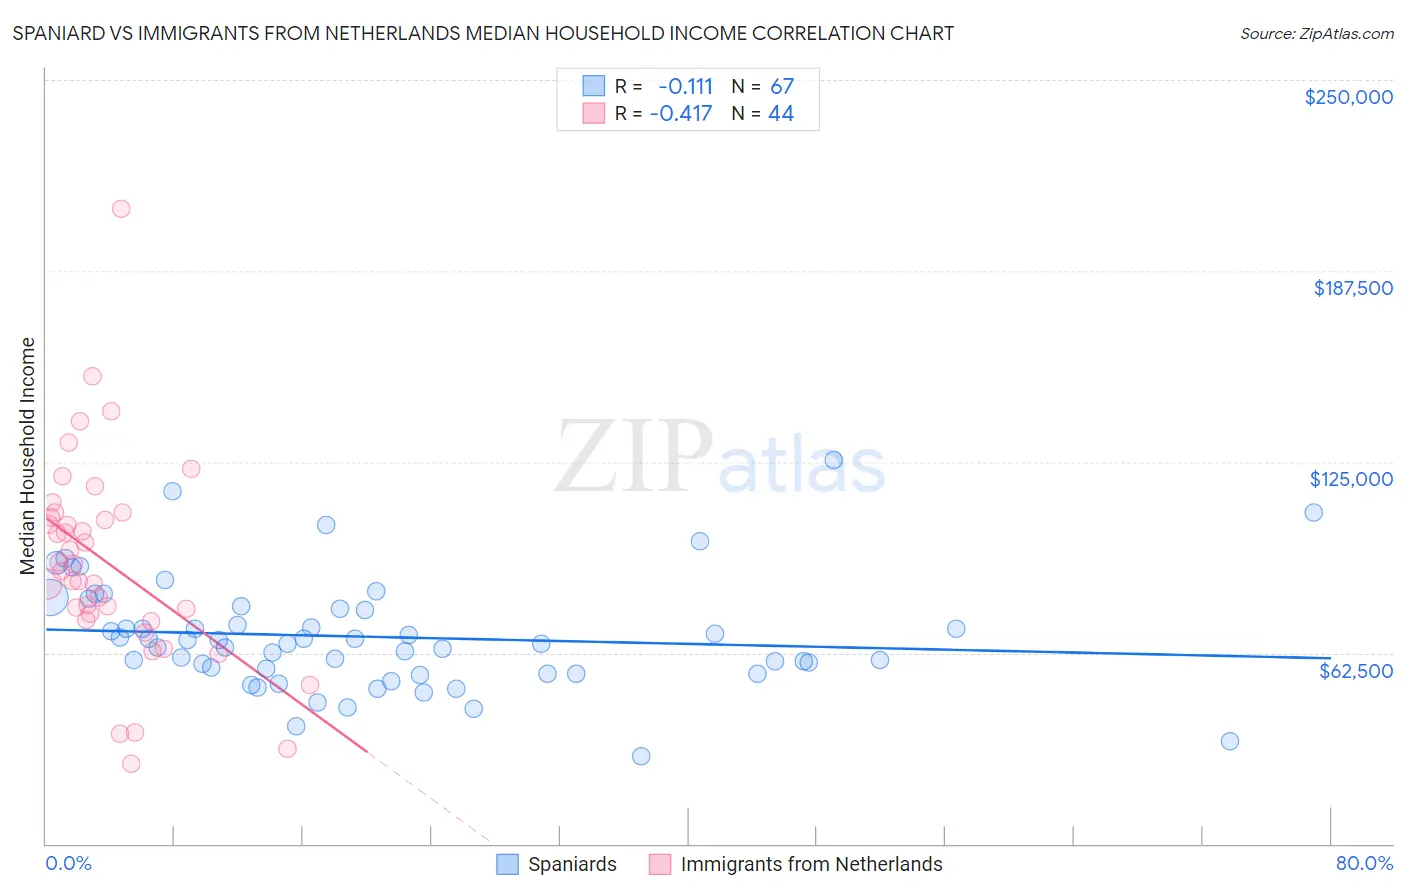
Spaniard vs Immigrants from Netherlands Median Household Income Correlation Chart
The statistical analysis conducted on geographies consisting of 443,014,990 people shows a poor negative correlation between the proportion of Spaniards and median household income in the United States with a correlation coefficient (R) of -0.111 and weighted average of $84,644. Similarly, the statistical analysis conducted on geographies consisting of 237,766,506 people shows a moderate negative correlation between the proportion of Immigrants from Netherlands and median household income in the United States with a correlation coefficient (R) of -0.417 and weighted average of $94,411, a difference of 11.5%.
Median Household Income Correlation Summary
| Measurement | Spaniard | Immigrants from Netherlands |
| Minimum | $28,571 | $26,321 |
| Maximum | $125,625 | $207,847 |
| Range | $97,054 | $181,526 |
| Mean | $67,731 | $92,018 |
| Median | $65,475 | $90,410 |
| Interquartile 25% (IQ1) | $55,726 | $74,172 |
| Interquartile 75% (IQ3) | $77,042 | $107,615 |
| Interquartile Range (IQR) | $21,316 | $33,443 |
| Standard Deviation (Sample) | $18,232 | $33,648 |
| Standard Deviation (Population) | $18,096 | $33,264 |
Similar Demographics by Median Household Income
Demographics Similar to Spaniards by Median Household Income
In terms of median household income, the demographic groups most similar to Spaniards are Uruguayan ($84,691, a difference of 0.060%), Hawaiian ($84,729, a difference of 0.10%), Immigrants from Portugal ($84,740, a difference of 0.11%), English ($84,915, a difference of 0.32%), and Czechoslovakian ($84,965, a difference of 0.38%).
| Demographics | Rating | Rank | Median Household Income |
| Alsatians | 49.2 /100 | #176 | Average $85,053 |
| Immigrants | Eritrea | 48.8 /100 | #177 | Average $85,025 |
| Czechoslovakians | 47.8 /100 | #178 | Average $84,965 |
| English | 47.0 /100 | #179 | Average $84,915 |
| Immigrants | Portugal | 44.2 /100 | #180 | Average $84,740 |
| Hawaiians | 44.1 /100 | #181 | Average $84,729 |
| Uruguayans | 43.5 /100 | #182 | Average $84,691 |
| Spaniards | 42.7 /100 | #183 | Average $84,644 |
| Immigrants | Eastern Africa | 37.4 /100 | #184 | Fair $84,299 |
| Kenyans | 34.2 /100 | #185 | Fair $84,085 |
| Puget Sound Salish | 33.2 /100 | #186 | Fair $84,011 |
| Belgians | 33.2 /100 | #187 | Fair $84,008 |
| Tlingit-Haida | 32.6 /100 | #188 | Fair $83,968 |
| Immigrants | Colombia | 31.7 /100 | #189 | Fair $83,902 |
| Slovaks | 30.2 /100 | #190 | Fair $83,798 |
Demographics Similar to Immigrants from Netherlands by Median Household Income
In terms of median household income, the demographic groups most similar to Immigrants from Netherlands are Immigrants from Belarus ($94,399, a difference of 0.010%), Immigrants from Romania ($94,222, a difference of 0.20%), Greek ($94,735, a difference of 0.34%), Immigrants from Scotland ($94,091, a difference of 0.34%), and Immigrants from Norway ($94,846, a difference of 0.46%).
| Demographics | Rating | Rank | Median Household Income |
| New Zealanders | 99.8 /100 | #57 | Exceptional $95,146 |
| Soviet Union | 99.8 /100 | #58 | Exceptional $95,098 |
| Immigrants | Europe | 99.8 /100 | #59 | Exceptional $95,032 |
| Koreans | 99.8 /100 | #60 | Exceptional $95,018 |
| Laotians | 99.8 /100 | #61 | Exceptional $94,990 |
| Immigrants | Norway | 99.8 /100 | #62 | Exceptional $94,846 |
| Greeks | 99.8 /100 | #63 | Exceptional $94,735 |
| Immigrants | Netherlands | 99.7 /100 | #64 | Exceptional $94,411 |
| Immigrants | Belarus | 99.7 /100 | #65 | Exceptional $94,399 |
| Immigrants | Romania | 99.7 /100 | #66 | Exceptional $94,222 |
| Immigrants | Scotland | 99.7 /100 | #67 | Exceptional $94,091 |
| Mongolians | 99.7 /100 | #68 | Exceptional $93,971 |
| Argentineans | 99.7 /100 | #69 | Exceptional $93,960 |
| Immigrants | Fiji | 99.7 /100 | #70 | Exceptional $93,933 |
| Immigrants | Philippines | 99.6 /100 | #71 | Exceptional $93,899 |