Immigrants from Cameroon vs Immigrants from Netherlands Median Household Income
COMPARE
Immigrants from Cameroon
Immigrants from Netherlands
Median Household Income
Median Household Income Comparison
Immigrants from Cameroon
Immigrants from Netherlands
$85,314
MEDIAN HOUSEHOLD INCOME
53.4/ 100
METRIC RATING
173rd/ 347
METRIC RANK
$94,411
MEDIAN HOUSEHOLD INCOME
99.7/ 100
METRIC RATING
64th/ 347
METRIC RANK
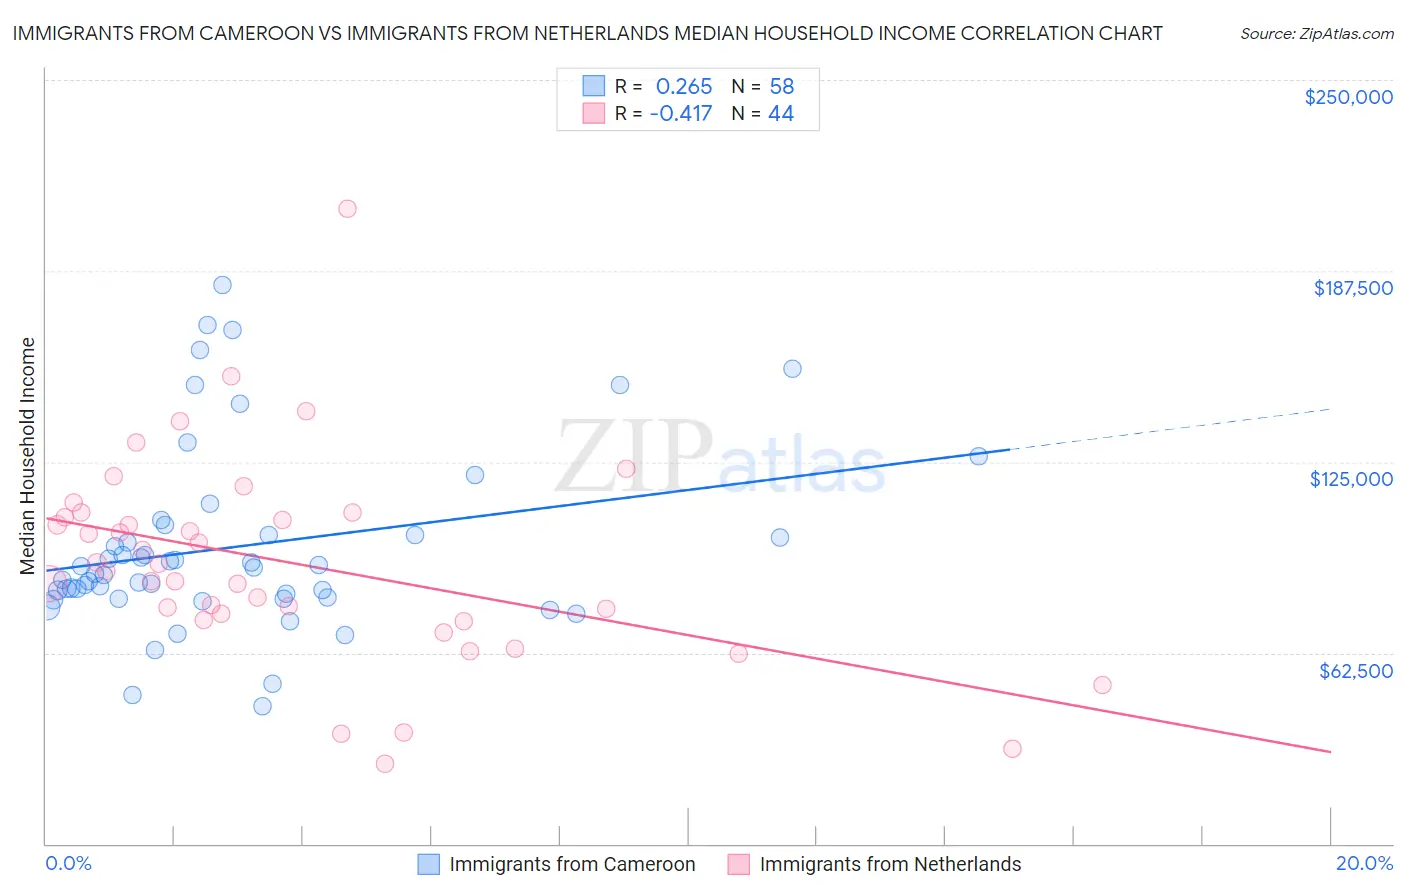
Immigrants from Cameroon vs Immigrants from Netherlands Median Household Income Correlation Chart
The statistical analysis conducted on geographies consisting of 130,731,775 people shows a weak positive correlation between the proportion of Immigrants from Cameroon and median household income in the United States with a correlation coefficient (R) of 0.265 and weighted average of $85,314. Similarly, the statistical analysis conducted on geographies consisting of 237,766,506 people shows a moderate negative correlation between the proportion of Immigrants from Netherlands and median household income in the United States with a correlation coefficient (R) of -0.417 and weighted average of $94,411, a difference of 10.7%.
Median Household Income Correlation Summary
| Measurement | Immigrants from Cameroon | Immigrants from Netherlands |
| Minimum | $44,950 | $26,321 |
| Maximum | $182,977 | $207,847 |
| Range | $138,027 | $181,526 |
| Mean | $97,309 | $92,018 |
| Median | $89,399 | $90,410 |
| Interquartile 25% (IQ1) | $80,569 | $74,172 |
| Interquartile 75% (IQ3) | $100,974 | $107,615 |
| Interquartile Range (IQR) | $20,405 | $33,443 |
| Standard Deviation (Sample) | $30,114 | $33,648 |
| Standard Deviation (Population) | $29,854 | $33,264 |
Similar Demographics by Median Household Income
Demographics Similar to Immigrants from Cameroon by Median Household Income
In terms of median household income, the demographic groups most similar to Immigrants from Cameroon are Scottish ($85,101, a difference of 0.25%), Slovene ($85,562, a difference of 0.29%), Immigrants from Costa Rica ($85,054, a difference of 0.31%), Alsatian ($85,053, a difference of 0.31%), and Immigrants from Eritrea ($85,025, a difference of 0.34%).
| Demographics | Rating | Rank | Median Household Income |
| Scandinavians | 65.1 /100 | #166 | Good $86,073 |
| Immigrants | Immigrants | 61.3 /100 | #167 | Good $85,818 |
| Icelanders | 61.0 /100 | #168 | Good $85,797 |
| Colombians | 59.7 /100 | #169 | Average $85,716 |
| Swiss | 59.2 /100 | #170 | Average $85,681 |
| Immigrants | South America | 58.1 /100 | #171 | Average $85,611 |
| Slovenes | 57.4 /100 | #172 | Average $85,562 |
| Immigrants | Cameroon | 53.4 /100 | #173 | Average $85,314 |
| Scottish | 50.0 /100 | #174 | Average $85,101 |
| Immigrants | Costa Rica | 49.2 /100 | #175 | Average $85,054 |
| Alsatians | 49.2 /100 | #176 | Average $85,053 |
| Immigrants | Eritrea | 48.8 /100 | #177 | Average $85,025 |
| Czechoslovakians | 47.8 /100 | #178 | Average $84,965 |
| English | 47.0 /100 | #179 | Average $84,915 |
| Immigrants | Portugal | 44.2 /100 | #180 | Average $84,740 |
Demographics Similar to Immigrants from Netherlands by Median Household Income
In terms of median household income, the demographic groups most similar to Immigrants from Netherlands are Immigrants from Belarus ($94,399, a difference of 0.010%), Immigrants from Romania ($94,222, a difference of 0.20%), Greek ($94,735, a difference of 0.34%), Immigrants from Scotland ($94,091, a difference of 0.34%), and Immigrants from Norway ($94,846, a difference of 0.46%).
| Demographics | Rating | Rank | Median Household Income |
| New Zealanders | 99.8 /100 | #57 | Exceptional $95,146 |
| Soviet Union | 99.8 /100 | #58 | Exceptional $95,098 |
| Immigrants | Europe | 99.8 /100 | #59 | Exceptional $95,032 |
| Koreans | 99.8 /100 | #60 | Exceptional $95,018 |
| Laotians | 99.8 /100 | #61 | Exceptional $94,990 |
| Immigrants | Norway | 99.8 /100 | #62 | Exceptional $94,846 |
| Greeks | 99.8 /100 | #63 | Exceptional $94,735 |
| Immigrants | Netherlands | 99.7 /100 | #64 | Exceptional $94,411 |
| Immigrants | Belarus | 99.7 /100 | #65 | Exceptional $94,399 |
| Immigrants | Romania | 99.7 /100 | #66 | Exceptional $94,222 |
| Immigrants | Scotland | 99.7 /100 | #67 | Exceptional $94,091 |
| Mongolians | 99.7 /100 | #68 | Exceptional $93,971 |
| Argentineans | 99.7 /100 | #69 | Exceptional $93,960 |
| Immigrants | Fiji | 99.7 /100 | #70 | Exceptional $93,933 |
| Immigrants | Philippines | 99.6 /100 | #71 | Exceptional $93,899 |