Hmong vs Immigrants from Netherlands Median Household Income
COMPARE
Hmong
Immigrants from Netherlands
Median Household Income
Median Household Income Comparison
Hmong
Immigrants from Netherlands
$75,839
MEDIAN HOUSEHOLD INCOME
0.3/ 100
METRIC RATING
270th/ 347
METRIC RANK
$94,411
MEDIAN HOUSEHOLD INCOME
99.7/ 100
METRIC RATING
64th/ 347
METRIC RANK
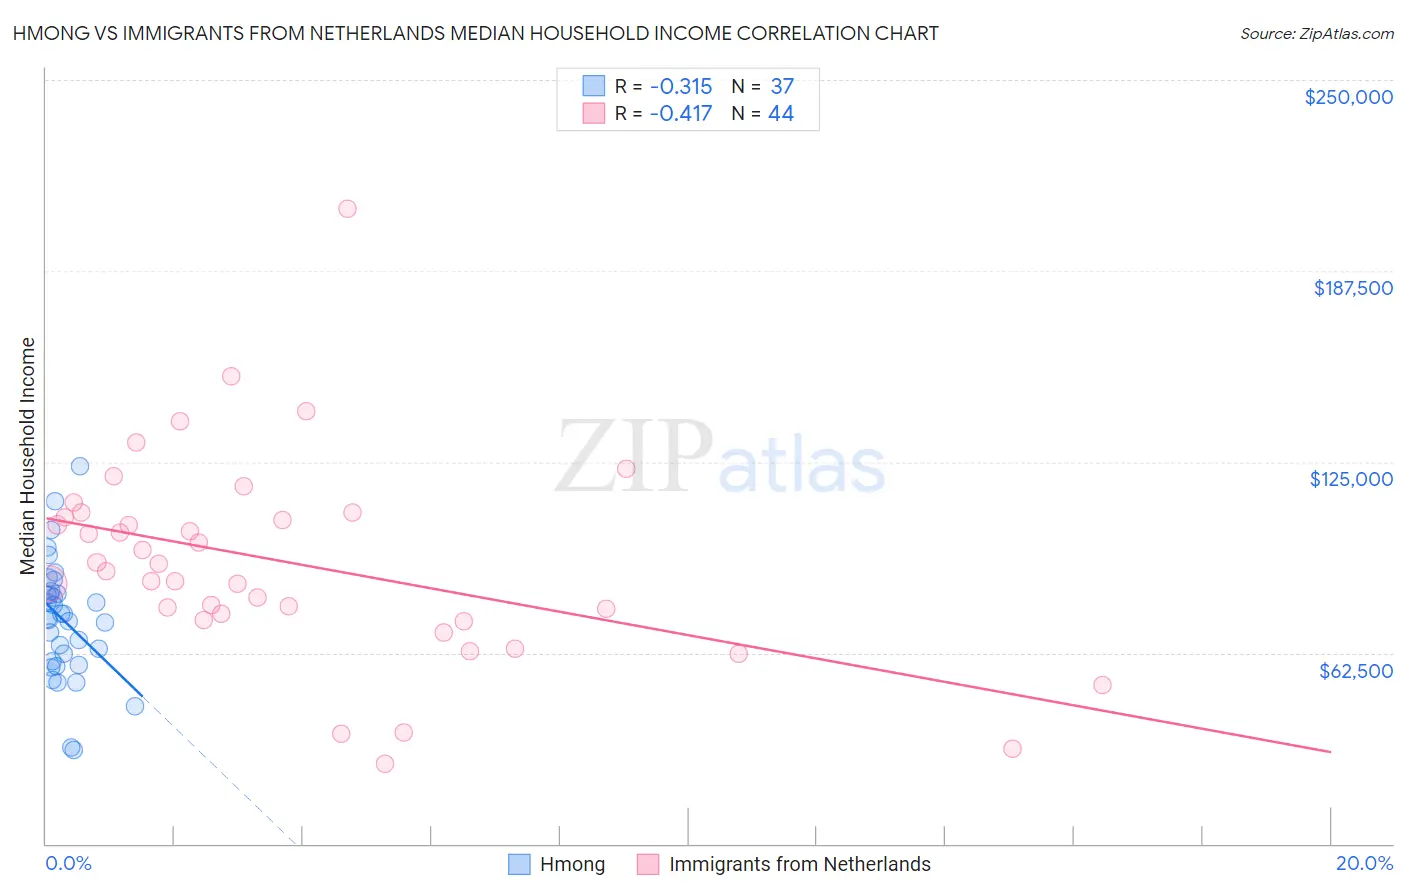
Hmong vs Immigrants from Netherlands Median Household Income Correlation Chart
The statistical analysis conducted on geographies consisting of 24,655,529 people shows a mild negative correlation between the proportion of Hmong and median household income in the United States with a correlation coefficient (R) of -0.315 and weighted average of $75,839. Similarly, the statistical analysis conducted on geographies consisting of 237,766,506 people shows a moderate negative correlation between the proportion of Immigrants from Netherlands and median household income in the United States with a correlation coefficient (R) of -0.417 and weighted average of $94,411, a difference of 24.5%.
Median Household Income Correlation Summary
| Measurement | Hmong | Immigrants from Netherlands |
| Minimum | $30,679 | $26,321 |
| Maximum | $123,750 | $207,847 |
| Range | $93,071 | $181,526 |
| Mean | $73,160 | $92,018 |
| Median | $73,828 | $90,410 |
| Interquartile 25% (IQ1) | $59,130 | $74,172 |
| Interquartile 75% (IQ3) | $82,249 | $107,615 |
| Interquartile Range (IQR) | $23,119 | $33,443 |
| Standard Deviation (Sample) | $19,589 | $33,648 |
| Standard Deviation (Population) | $19,322 | $33,264 |
Similar Demographics by Median Household Income
Demographics Similar to Hmong by Median Household Income
In terms of median household income, the demographic groups most similar to Hmong are Cape Verdean ($75,848, a difference of 0.010%), German Russian ($75,856, a difference of 0.020%), Immigrants from Jamaica ($75,851, a difference of 0.020%), Pennsylvania German ($75,814, a difference of 0.030%), and Somali ($75,782, a difference of 0.080%).
| Demographics | Rating | Rank | Median Household Income |
| Alaskan Athabascans | 0.4 /100 | #263 | Tragic $76,383 |
| Guatemalans | 0.3 /100 | #264 | Tragic $75,961 |
| Immigrants | Belize | 0.3 /100 | #265 | Tragic $75,938 |
| Americans | 0.3 /100 | #266 | Tragic $75,932 |
| German Russians | 0.3 /100 | #267 | Tragic $75,856 |
| Immigrants | Jamaica | 0.3 /100 | #268 | Tragic $75,851 |
| Cape Verdeans | 0.3 /100 | #269 | Tragic $75,848 |
| Hmong | 0.3 /100 | #270 | Tragic $75,839 |
| Pennsylvania Germans | 0.3 /100 | #271 | Tragic $75,814 |
| Somalis | 0.3 /100 | #272 | Tragic $75,782 |
| Liberians | 0.2 /100 | #273 | Tragic $75,667 |
| British West Indians | 0.2 /100 | #274 | Tragic $75,647 |
| Immigrants | Micronesia | 0.2 /100 | #275 | Tragic $75,574 |
| Immigrants | Latin America | 0.2 /100 | #276 | Tragic $75,420 |
| Spanish Americans | 0.2 /100 | #277 | Tragic $75,386 |
Demographics Similar to Immigrants from Netherlands by Median Household Income
In terms of median household income, the demographic groups most similar to Immigrants from Netherlands are Immigrants from Belarus ($94,399, a difference of 0.010%), Immigrants from Romania ($94,222, a difference of 0.20%), Greek ($94,735, a difference of 0.34%), Immigrants from Scotland ($94,091, a difference of 0.34%), and Immigrants from Norway ($94,846, a difference of 0.46%).
| Demographics | Rating | Rank | Median Household Income |
| New Zealanders | 99.8 /100 | #57 | Exceptional $95,146 |
| Soviet Union | 99.8 /100 | #58 | Exceptional $95,098 |
| Immigrants | Europe | 99.8 /100 | #59 | Exceptional $95,032 |
| Koreans | 99.8 /100 | #60 | Exceptional $95,018 |
| Laotians | 99.8 /100 | #61 | Exceptional $94,990 |
| Immigrants | Norway | 99.8 /100 | #62 | Exceptional $94,846 |
| Greeks | 99.8 /100 | #63 | Exceptional $94,735 |
| Immigrants | Netherlands | 99.7 /100 | #64 | Exceptional $94,411 |
| Immigrants | Belarus | 99.7 /100 | #65 | Exceptional $94,399 |
| Immigrants | Romania | 99.7 /100 | #66 | Exceptional $94,222 |
| Immigrants | Scotland | 99.7 /100 | #67 | Exceptional $94,091 |
| Mongolians | 99.7 /100 | #68 | Exceptional $93,971 |
| Argentineans | 99.7 /100 | #69 | Exceptional $93,960 |
| Immigrants | Fiji | 99.7 /100 | #70 | Exceptional $93,933 |
| Immigrants | Philippines | 99.6 /100 | #71 | Exceptional $93,899 |