Aleut vs Immigrants from Dominican Republic Median Household Income
COMPARE
Aleut
Immigrants from Dominican Republic
Median Household Income
Median Household Income Comparison
Aleuts
Immigrants from Dominican Republic
$83,446
MEDIAN HOUSEHOLD INCOME
25.7/ 100
METRIC RATING
197th/ 347
METRIC RANK
$70,208
MEDIAN HOUSEHOLD INCOME
0.0/ 100
METRIC RATING
319th/ 347
METRIC RANK
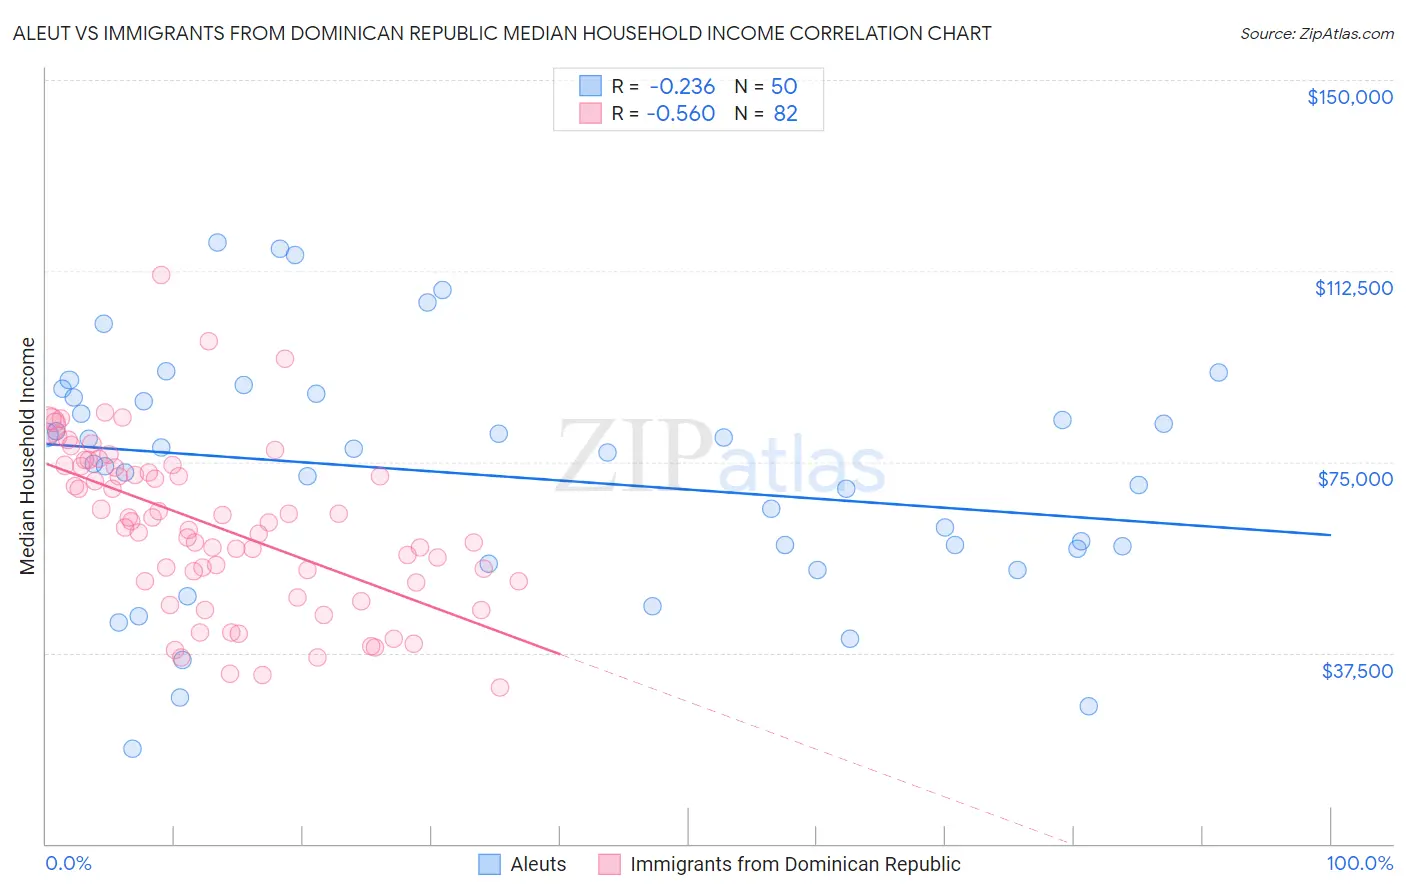
Aleut vs Immigrants from Dominican Republic Median Household Income Correlation Chart
The statistical analysis conducted on geographies consisting of 61,772,916 people shows a weak negative correlation between the proportion of Aleuts and median household income in the United States with a correlation coefficient (R) of -0.236 and weighted average of $83,446. Similarly, the statistical analysis conducted on geographies consisting of 274,922,738 people shows a substantial negative correlation between the proportion of Immigrants from Dominican Republic and median household income in the United States with a correlation coefficient (R) of -0.560 and weighted average of $70,208, a difference of 18.9%.
Median Household Income Correlation Summary
| Measurement | Aleut | Immigrants from Dominican Republic |
| Minimum | $18,750 | $30,696 |
| Maximum | $117,969 | $111,701 |
| Range | $99,219 | $81,005 |
| Mean | $72,433 | $62,334 |
| Median | $75,755 | $62,616 |
| Interquartile 25% (IQ1) | $58,000 | $51,486 |
| Interquartile 75% (IQ3) | $87,683 | $74,129 |
| Interquartile Range (IQR) | $29,683 | $22,642 |
| Standard Deviation (Sample) | $23,307 | $16,292 |
| Standard Deviation (Population) | $23,073 | $16,192 |
Similar Demographics by Median Household Income
Demographics Similar to Aleuts by Median Household Income
In terms of median household income, the demographic groups most similar to Aleuts are French ($83,468, a difference of 0.030%), Japanese ($83,395, a difference of 0.060%), German ($83,358, a difference of 0.11%), Tsimshian ($83,346, a difference of 0.12%), and Spanish ($83,343, a difference of 0.12%).
| Demographics | Rating | Rank | Median Household Income |
| Slovaks | 30.2 /100 | #190 | Fair $83,798 |
| Iraqis | 29.6 /100 | #191 | Fair $83,753 |
| Welsh | 28.0 /100 | #192 | Fair $83,628 |
| Finns | 27.7 /100 | #193 | Fair $83,607 |
| Ghanaians | 27.4 /100 | #194 | Fair $83,582 |
| Immigrants | Armenia | 27.0 /100 | #195 | Fair $83,555 |
| French | 26.0 /100 | #196 | Fair $83,468 |
| Aleuts | 25.7 /100 | #197 | Fair $83,446 |
| Japanese | 25.1 /100 | #198 | Fair $83,395 |
| Germans | 24.6 /100 | #199 | Fair $83,358 |
| Tsimshian | 24.5 /100 | #200 | Fair $83,346 |
| Spanish | 24.4 /100 | #201 | Fair $83,343 |
| Immigrants | Thailand | 24.3 /100 | #202 | Fair $83,327 |
| Immigrants | Cambodia | 24.0 /100 | #203 | Fair $83,304 |
| Immigrants | Africa | 23.8 /100 | #204 | Fair $83,289 |
Demographics Similar to Immigrants from Dominican Republic by Median Household Income
In terms of median household income, the demographic groups most similar to Immigrants from Dominican Republic are Colville ($70,094, a difference of 0.16%), Chickasaw ($70,005, a difference of 0.29%), Choctaw ($69,947, a difference of 0.37%), Chippewa ($70,539, a difference of 0.47%), and Cajun ($70,605, a difference of 0.56%).
| Demographics | Rating | Rank | Median Household Income |
| Immigrants | Honduras | 0.0 /100 | #312 | Tragic $71,452 |
| Immigrants | Bahamas | 0.0 /100 | #313 | Tragic $71,349 |
| Dominicans | 0.0 /100 | #314 | Tragic $71,302 |
| Ottawa | 0.0 /100 | #315 | Tragic $70,984 |
| Apache | 0.0 /100 | #316 | Tragic $70,927 |
| Cajuns | 0.0 /100 | #317 | Tragic $70,605 |
| Chippewa | 0.0 /100 | #318 | Tragic $70,539 |
| Immigrants | Dominican Republic | 0.0 /100 | #319 | Tragic $70,208 |
| Colville | 0.0 /100 | #320 | Tragic $70,094 |
| Chickasaw | 0.0 /100 | #321 | Tragic $70,005 |
| Choctaw | 0.0 /100 | #322 | Tragic $69,947 |
| Bahamians | 0.0 /100 | #323 | Tragic $69,726 |
| Yup'ik | 0.0 /100 | #324 | Tragic $69,695 |
| Seminole | 0.0 /100 | #325 | Tragic $69,420 |
| Yuman | 0.0 /100 | #326 | Tragic $68,743 |