Cambodian vs Immigrants from Netherlands Median Household Income
COMPARE
Cambodian
Immigrants from Netherlands
Median Household Income
Median Household Income Comparison
Cambodians
Immigrants from Netherlands
$96,324
MEDIAN HOUSEHOLD INCOME
99.9/ 100
METRIC RATING
48th/ 347
METRIC RANK
$94,411
MEDIAN HOUSEHOLD INCOME
99.7/ 100
METRIC RATING
64th/ 347
METRIC RANK
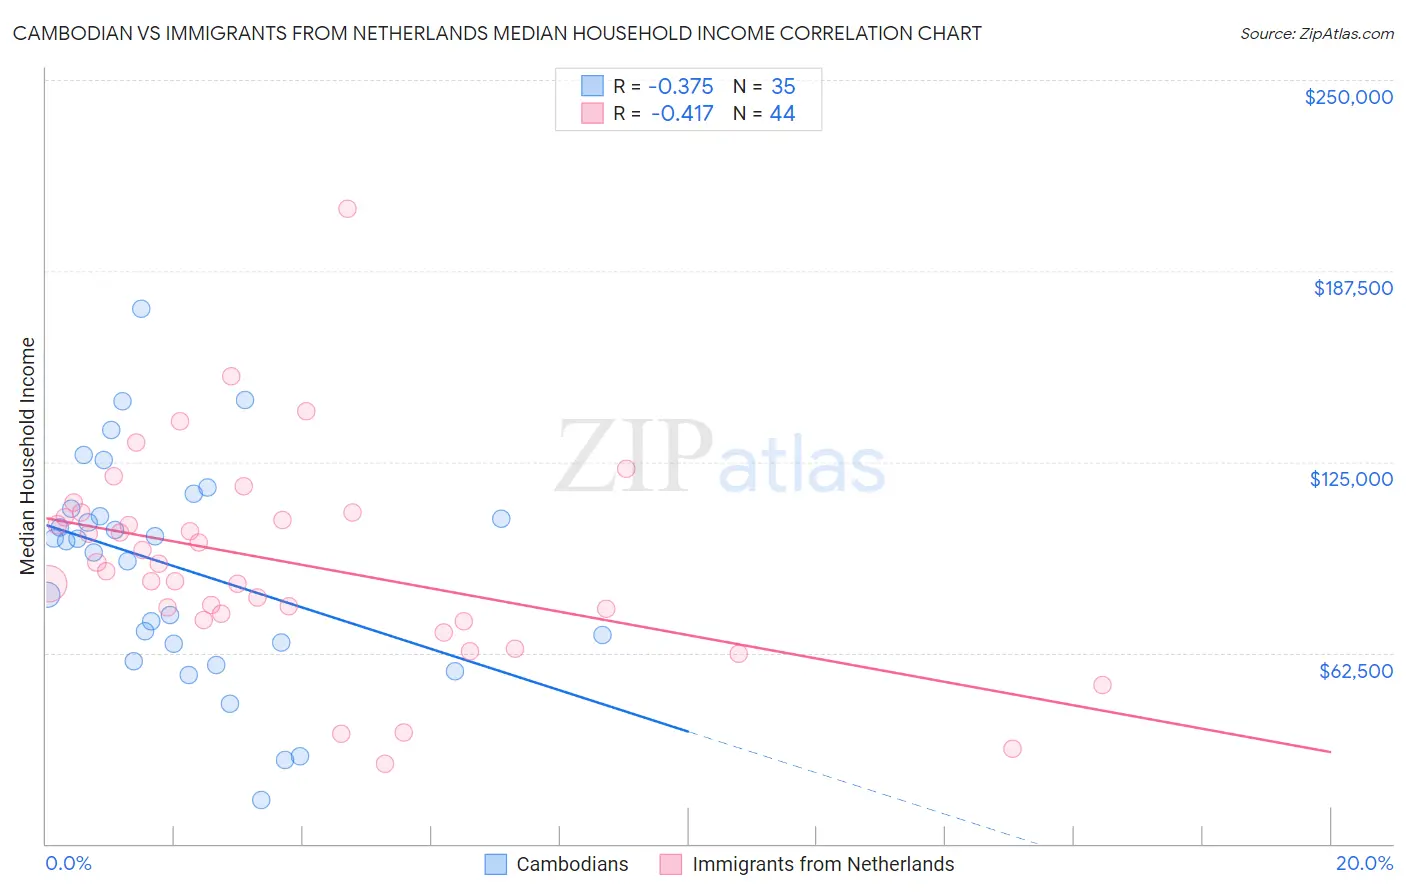
Cambodian vs Immigrants from Netherlands Median Household Income Correlation Chart
The statistical analysis conducted on geographies consisting of 102,460,584 people shows a mild negative correlation between the proportion of Cambodians and median household income in the United States with a correlation coefficient (R) of -0.375 and weighted average of $96,324. Similarly, the statistical analysis conducted on geographies consisting of 237,766,506 people shows a moderate negative correlation between the proportion of Immigrants from Netherlands and median household income in the United States with a correlation coefficient (R) of -0.417 and weighted average of $94,411, a difference of 2.0%.
Median Household Income Correlation Summary
| Measurement | Cambodian | Immigrants from Netherlands |
| Minimum | $14,319 | $26,321 |
| Maximum | $174,929 | $207,847 |
| Range | $160,610 | $181,526 |
| Mean | $90,039 | $92,018 |
| Median | $99,162 | $90,410 |
| Interquartile 25% (IQ1) | $65,313 | $74,172 |
| Interquartile 75% (IQ3) | $109,510 | $107,615 |
| Interquartile Range (IQR) | $44,197 | $33,443 |
| Standard Deviation (Sample) | $35,802 | $33,648 |
| Standard Deviation (Population) | $35,287 | $33,264 |
Demographics Similar to Cambodians and Immigrants from Netherlands by Median Household Income
In terms of median household income, the demographic groups most similar to Cambodians are Immigrants from Malaysia ($96,292, a difference of 0.030%), Bulgarian ($96,290, a difference of 0.040%), Immigrants from Russia ($96,378, a difference of 0.060%), Australian ($96,490, a difference of 0.17%), and Estonian ($95,930, a difference of 0.41%). Similarly, the demographic groups most similar to Immigrants from Netherlands are Immigrants from Belarus ($94,399, a difference of 0.010%), Immigrants from Romania ($94,222, a difference of 0.20%), Greek ($94,735, a difference of 0.34%), Immigrants from Norway ($94,846, a difference of 0.46%), and Laotian ($94,990, a difference of 0.61%).
| Demographics | Rating | Rank | Median Household Income |
| Australians | 99.9 /100 | #46 | Exceptional $96,490 |
| Immigrants | Russia | 99.9 /100 | #47 | Exceptional $96,378 |
| Cambodians | 99.9 /100 | #48 | Exceptional $96,324 |
| Immigrants | Malaysia | 99.9 /100 | #49 | Exceptional $96,292 |
| Bulgarians | 99.9 /100 | #50 | Exceptional $96,290 |
| Estonians | 99.9 /100 | #51 | Exceptional $95,930 |
| Immigrants | South Africa | 99.9 /100 | #52 | Exceptional $95,800 |
| Paraguayans | 99.9 /100 | #53 | Exceptional $95,737 |
| Egyptians | 99.9 /100 | #54 | Exceptional $95,673 |
| Immigrants | Czechoslovakia | 99.9 /100 | #55 | Exceptional $95,319 |
| Immigrants | Austria | 99.9 /100 | #56 | Exceptional $95,277 |
| New Zealanders | 99.8 /100 | #57 | Exceptional $95,146 |
| Soviet Union | 99.8 /100 | #58 | Exceptional $95,098 |
| Immigrants | Europe | 99.8 /100 | #59 | Exceptional $95,032 |
| Koreans | 99.8 /100 | #60 | Exceptional $95,018 |
| Laotians | 99.8 /100 | #61 | Exceptional $94,990 |
| Immigrants | Norway | 99.8 /100 | #62 | Exceptional $94,846 |
| Greeks | 99.8 /100 | #63 | Exceptional $94,735 |
| Immigrants | Netherlands | 99.7 /100 | #64 | Exceptional $94,411 |
| Immigrants | Belarus | 99.7 /100 | #65 | Exceptional $94,399 |
| Immigrants | Romania | 99.7 /100 | #66 | Exceptional $94,222 |