Aleut vs Ugandan Median Household Income
COMPARE
Aleut
Ugandan
Median Household Income
Median Household Income Comparison
Aleuts
Ugandans
$83,446
MEDIAN HOUSEHOLD INCOME
25.7/ 100
METRIC RATING
197th/ 347
METRIC RANK
$87,557
MEDIAN HOUSEHOLD INCOME
82.9/ 100
METRIC RATING
145th/ 347
METRIC RANK
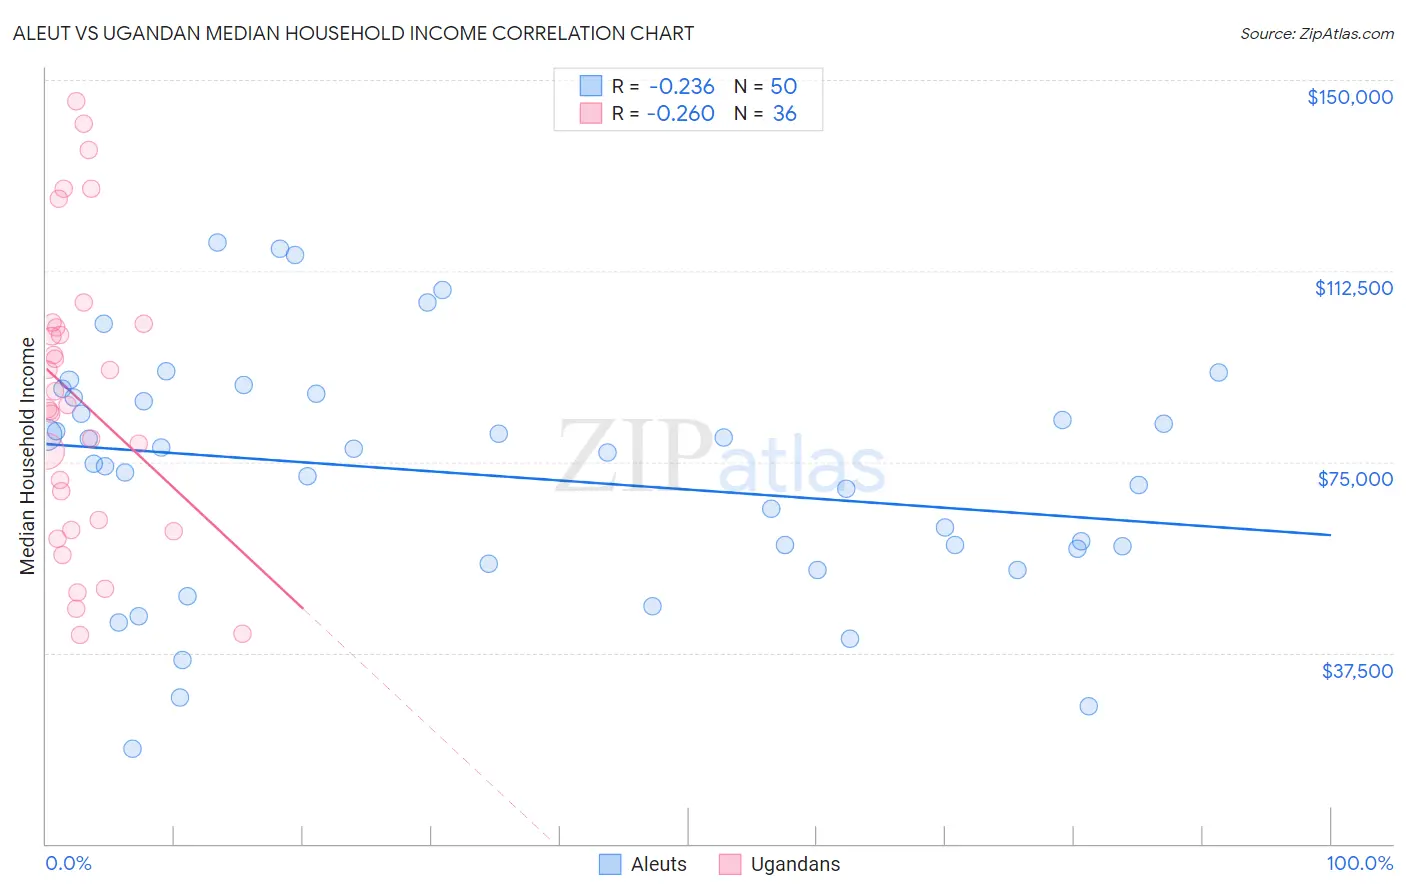
Aleut vs Ugandan Median Household Income Correlation Chart
The statistical analysis conducted on geographies consisting of 61,772,916 people shows a weak negative correlation between the proportion of Aleuts and median household income in the United States with a correlation coefficient (R) of -0.236 and weighted average of $83,446. Similarly, the statistical analysis conducted on geographies consisting of 93,988,402 people shows a weak negative correlation between the proportion of Ugandans and median household income in the United States with a correlation coefficient (R) of -0.260 and weighted average of $87,557, a difference of 4.9%.
Median Household Income Correlation Summary
| Measurement | Aleut | Ugandan |
| Minimum | $18,750 | $40,977 |
| Maximum | $117,969 | $145,769 |
| Range | $99,219 | $104,792 |
| Mean | $72,433 | $87,043 |
| Median | $75,755 | $85,898 |
| Interquartile 25% (IQ1) | $58,000 | $62,590 |
| Interquartile 75% (IQ3) | $87,683 | $101,783 |
| Interquartile Range (IQR) | $29,683 | $39,193 |
| Standard Deviation (Sample) | $23,307 | $28,515 |
| Standard Deviation (Population) | $23,073 | $28,116 |
Similar Demographics by Median Household Income
Demographics Similar to Aleuts by Median Household Income
In terms of median household income, the demographic groups most similar to Aleuts are French ($83,468, a difference of 0.030%), Japanese ($83,395, a difference of 0.060%), German ($83,358, a difference of 0.11%), Tsimshian ($83,346, a difference of 0.12%), and Spanish ($83,343, a difference of 0.12%).
| Demographics | Rating | Rank | Median Household Income |
| Slovaks | 30.2 /100 | #190 | Fair $83,798 |
| Iraqis | 29.6 /100 | #191 | Fair $83,753 |
| Welsh | 28.0 /100 | #192 | Fair $83,628 |
| Finns | 27.7 /100 | #193 | Fair $83,607 |
| Ghanaians | 27.4 /100 | #194 | Fair $83,582 |
| Immigrants | Armenia | 27.0 /100 | #195 | Fair $83,555 |
| French | 26.0 /100 | #196 | Fair $83,468 |
| Aleuts | 25.7 /100 | #197 | Fair $83,446 |
| Japanese | 25.1 /100 | #198 | Fair $83,395 |
| Germans | 24.6 /100 | #199 | Fair $83,358 |
| Tsimshian | 24.5 /100 | #200 | Fair $83,346 |
| Spanish | 24.4 /100 | #201 | Fair $83,343 |
| Immigrants | Thailand | 24.3 /100 | #202 | Fair $83,327 |
| Immigrants | Cambodia | 24.0 /100 | #203 | Fair $83,304 |
| Immigrants | Africa | 23.8 /100 | #204 | Fair $83,289 |
Demographics Similar to Ugandans by Median Household Income
In terms of median household income, the demographic groups most similar to Ugandans are Immigrants from Uganda ($87,553, a difference of 0.0%), Serbian ($87,572, a difference of 0.020%), South American Indian ($87,446, a difference of 0.13%), Danish ($87,676, a difference of 0.14%), and Canadian ($87,769, a difference of 0.24%).
| Demographics | Rating | Rank | Median Household Income |
| Arabs | 89.2 /100 | #138 | Excellent $88,398 |
| Immigrants | Chile | 89.2 /100 | #139 | Excellent $88,388 |
| Lebanese | 87.2 /100 | #140 | Excellent $88,091 |
| Immigrants | Morocco | 86.0 /100 | #141 | Excellent $87,930 |
| Canadians | 84.7 /100 | #142 | Excellent $87,769 |
| Danes | 83.9 /100 | #143 | Excellent $87,676 |
| Serbians | 83.0 /100 | #144 | Excellent $87,572 |
| Ugandans | 82.9 /100 | #145 | Excellent $87,557 |
| Immigrants | Uganda | 82.8 /100 | #146 | Excellent $87,553 |
| South American Indians | 81.8 /100 | #147 | Excellent $87,446 |
| Costa Ricans | 80.0 /100 | #148 | Excellent $87,262 |
| Immigrants | Nepal | 77.7 /100 | #149 | Good $87,046 |
| Basques | 77.2 /100 | #150 | Good $87,001 |
| Hungarians | 76.3 /100 | #151 | Good $86,920 |
| Immigrants | Saudi Arabia | 75.8 /100 | #152 | Good $86,875 |