Houma vs Immigrants from Netherlands Median Household Income
COMPARE
Houma
Immigrants from Netherlands
Median Household Income
Median Household Income Comparison
Houma
Immigrants from Netherlands
$62,575
MEDIAN HOUSEHOLD INCOME
0.0/ 100
METRIC RATING
343rd/ 347
METRIC RANK
$94,411
MEDIAN HOUSEHOLD INCOME
99.7/ 100
METRIC RATING
64th/ 347
METRIC RANK
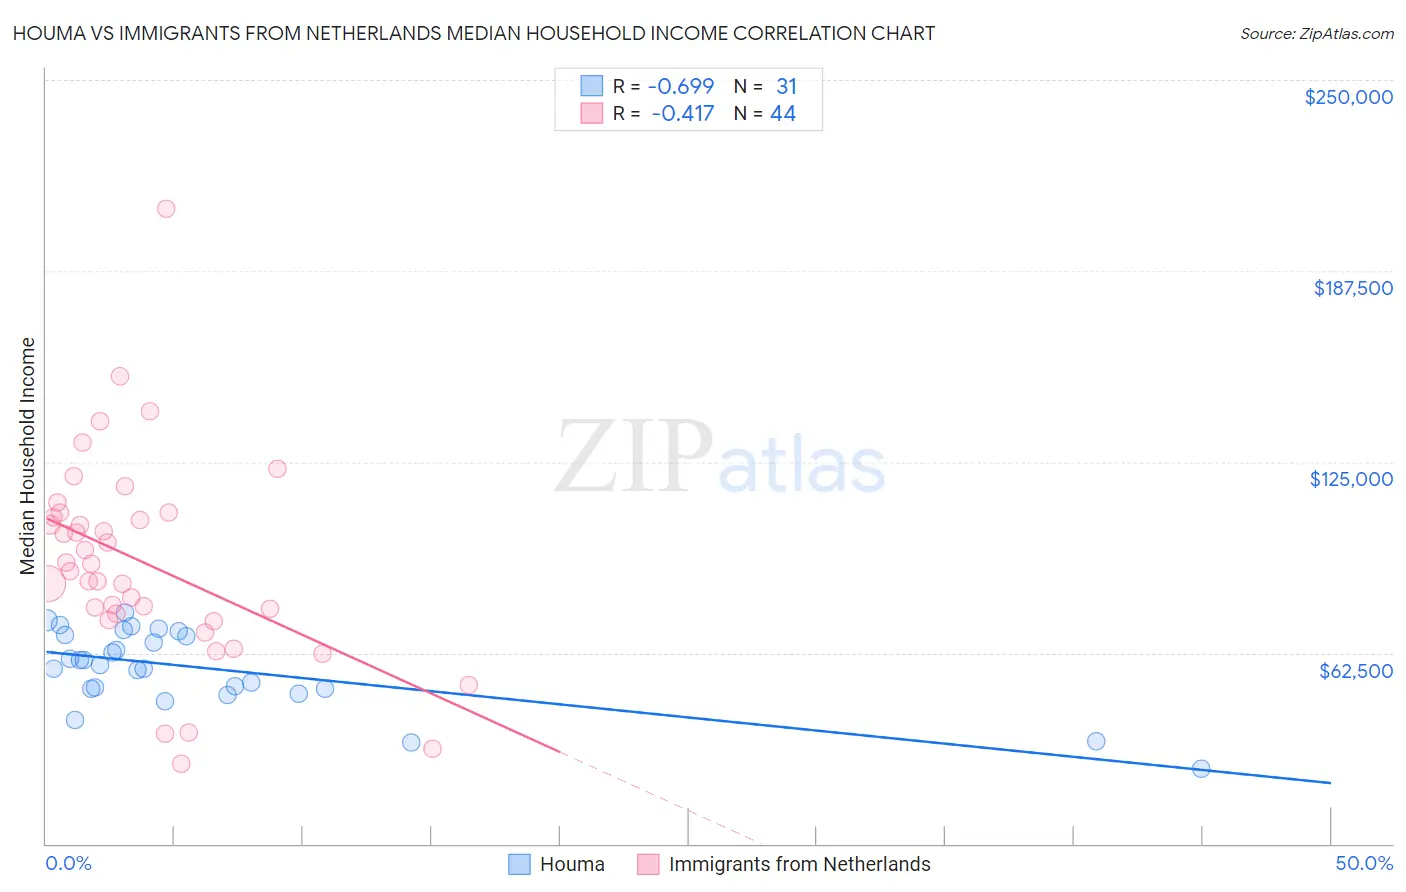
Houma vs Immigrants from Netherlands Median Household Income Correlation Chart
The statistical analysis conducted on geographies consisting of 36,792,126 people shows a significant negative correlation between the proportion of Houma and median household income in the United States with a correlation coefficient (R) of -0.699 and weighted average of $62,575. Similarly, the statistical analysis conducted on geographies consisting of 237,766,506 people shows a moderate negative correlation between the proportion of Immigrants from Netherlands and median household income in the United States with a correlation coefficient (R) of -0.417 and weighted average of $94,411, a difference of 50.9%.
Median Household Income Correlation Summary
| Measurement | Houma | Immigrants from Netherlands |
| Minimum | $24,706 | $26,321 |
| Maximum | $75,521 | $207,847 |
| Range | $50,815 | $181,526 |
| Mean | $57,222 | $92,018 |
| Median | $58,380 | $90,410 |
| Interquartile 25% (IQ1) | $50,766 | $74,172 |
| Interquartile 75% (IQ3) | $68,165 | $107,615 |
| Interquartile Range (IQR) | $17,398 | $33,443 |
| Standard Deviation (Sample) | $12,629 | $33,648 |
| Standard Deviation (Population) | $12,424 | $33,264 |
Similar Demographics by Median Household Income
Demographics Similar to Houma by Median Household Income
In terms of median household income, the demographic groups most similar to Houma are Pima ($63,262, a difference of 1.1%), Tohono O'odham ($61,663, a difference of 1.5%), Crow ($63,681, a difference of 1.8%), Pueblo ($64,692, a difference of 3.4%), and Hopi ($65,043, a difference of 3.9%).
| Demographics | Rating | Rank | Median Household Income |
| Creek | 0.0 /100 | #333 | Tragic $67,715 |
| Blacks/African Americans | 0.0 /100 | #334 | Tragic $67,573 |
| Cheyenne | 0.0 /100 | #335 | Tragic $66,974 |
| Immigrants | Congo | 0.0 /100 | #336 | Tragic $66,768 |
| Kiowa | 0.0 /100 | #337 | Tragic $65,914 |
| Immigrants | Yemen | 0.0 /100 | #338 | Tragic $65,194 |
| Hopi | 0.0 /100 | #339 | Tragic $65,043 |
| Pueblo | 0.0 /100 | #340 | Tragic $64,692 |
| Crow | 0.0 /100 | #341 | Tragic $63,681 |
| Pima | 0.0 /100 | #342 | Tragic $63,262 |
| Houma | 0.0 /100 | #343 | Tragic $62,575 |
| Tohono O'odham | 0.0 /100 | #344 | Tragic $61,663 |
| Puerto Ricans | 0.0 /100 | #345 | Tragic $59,197 |
| Navajo | 0.0 /100 | #346 | Tragic $59,159 |
| Lumbee | 0.0 /100 | #347 | Tragic $54,644 |
Demographics Similar to Immigrants from Netherlands by Median Household Income
In terms of median household income, the demographic groups most similar to Immigrants from Netherlands are Immigrants from Belarus ($94,399, a difference of 0.010%), Immigrants from Romania ($94,222, a difference of 0.20%), Greek ($94,735, a difference of 0.34%), Immigrants from Scotland ($94,091, a difference of 0.34%), and Immigrants from Norway ($94,846, a difference of 0.46%).
| Demographics | Rating | Rank | Median Household Income |
| New Zealanders | 99.8 /100 | #57 | Exceptional $95,146 |
| Soviet Union | 99.8 /100 | #58 | Exceptional $95,098 |
| Immigrants | Europe | 99.8 /100 | #59 | Exceptional $95,032 |
| Koreans | 99.8 /100 | #60 | Exceptional $95,018 |
| Laotians | 99.8 /100 | #61 | Exceptional $94,990 |
| Immigrants | Norway | 99.8 /100 | #62 | Exceptional $94,846 |
| Greeks | 99.8 /100 | #63 | Exceptional $94,735 |
| Immigrants | Netherlands | 99.7 /100 | #64 | Exceptional $94,411 |
| Immigrants | Belarus | 99.7 /100 | #65 | Exceptional $94,399 |
| Immigrants | Romania | 99.7 /100 | #66 | Exceptional $94,222 |
| Immigrants | Scotland | 99.7 /100 | #67 | Exceptional $94,091 |
| Mongolians | 99.7 /100 | #68 | Exceptional $93,971 |
| Argentineans | 99.7 /100 | #69 | Exceptional $93,960 |
| Immigrants | Fiji | 99.7 /100 | #70 | Exceptional $93,933 |
| Immigrants | Philippines | 99.6 /100 | #71 | Exceptional $93,899 |