Aleut vs Japanese Median Household Income
COMPARE
Aleut
Japanese
Median Household Income
Median Household Income Comparison
Aleuts
Japanese
$83,446
MEDIAN HOUSEHOLD INCOME
25.7/ 100
METRIC RATING
197th/ 347
METRIC RANK
$83,395
MEDIAN HOUSEHOLD INCOME
25.1/ 100
METRIC RATING
198th/ 347
METRIC RANK
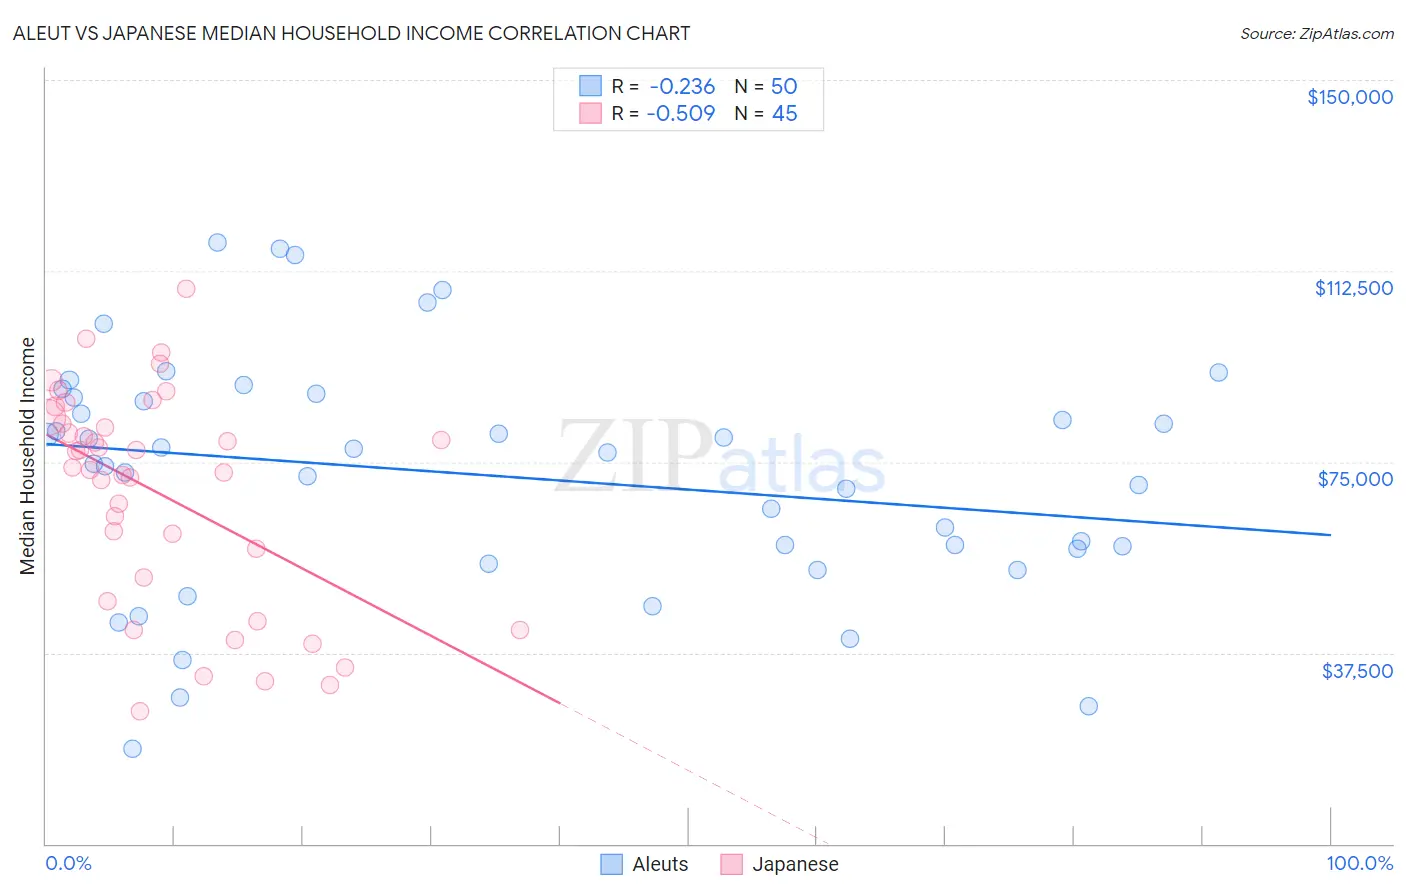
Aleut vs Japanese Median Household Income Correlation Chart
The statistical analysis conducted on geographies consisting of 61,772,916 people shows a weak negative correlation between the proportion of Aleuts and median household income in the United States with a correlation coefficient (R) of -0.236 and weighted average of $83,446. Similarly, the statistical analysis conducted on geographies consisting of 249,040,762 people shows a substantial negative correlation between the proportion of Japanese and median household income in the United States with a correlation coefficient (R) of -0.509 and weighted average of $83,395, a difference of 0.060%.
Median Household Income Correlation Summary
| Measurement | Aleut | Japanese |
| Minimum | $18,750 | $25,982 |
| Maximum | $117,969 | $108,958 |
| Range | $99,219 | $82,976 |
| Mean | $72,433 | $68,760 |
| Median | $75,755 | $73,852 |
| Interquartile 25% (IQ1) | $58,000 | $50,038 |
| Interquartile 75% (IQ3) | $87,683 | $83,119 |
| Interquartile Range (IQR) | $29,683 | $33,081 |
| Standard Deviation (Sample) | $23,307 | $21,079 |
| Standard Deviation (Population) | $23,073 | $20,843 |
Demographics Similar to Aleuts and Japanese by Median Household Income
In terms of median household income, the demographic groups most similar to Aleuts are French ($83,468, a difference of 0.030%), German ($83,358, a difference of 0.11%), Tsimshian ($83,346, a difference of 0.12%), Spanish ($83,343, a difference of 0.12%), and Immigrants from Armenia ($83,555, a difference of 0.13%). Similarly, the demographic groups most similar to Japanese are German ($83,358, a difference of 0.040%), Tsimshian ($83,346, a difference of 0.060%), Spanish ($83,343, a difference of 0.060%), Immigrants from Thailand ($83,327, a difference of 0.080%), and French ($83,468, a difference of 0.090%).
| Demographics | Rating | Rank | Median Household Income |
| Belgians | 33.2 /100 | #187 | Fair $84,008 |
| Tlingit-Haida | 32.6 /100 | #188 | Fair $83,968 |
| Immigrants | Colombia | 31.7 /100 | #189 | Fair $83,902 |
| Slovaks | 30.2 /100 | #190 | Fair $83,798 |
| Iraqis | 29.6 /100 | #191 | Fair $83,753 |
| Welsh | 28.0 /100 | #192 | Fair $83,628 |
| Finns | 27.7 /100 | #193 | Fair $83,607 |
| Ghanaians | 27.4 /100 | #194 | Fair $83,582 |
| Immigrants | Armenia | 27.0 /100 | #195 | Fair $83,555 |
| French | 26.0 /100 | #196 | Fair $83,468 |
| Aleuts | 25.7 /100 | #197 | Fair $83,446 |
| Japanese | 25.1 /100 | #198 | Fair $83,395 |
| Germans | 24.6 /100 | #199 | Fair $83,358 |
| Tsimshian | 24.5 /100 | #200 | Fair $83,346 |
| Spanish | 24.4 /100 | #201 | Fair $83,343 |
| Immigrants | Thailand | 24.3 /100 | #202 | Fair $83,327 |
| Immigrants | Cambodia | 24.0 /100 | #203 | Fair $83,304 |
| Immigrants | Africa | 23.8 /100 | #204 | Fair $83,289 |
| Celtics | 22.7 /100 | #205 | Fair $83,193 |
| Immigrants | Kenya | 21.3 /100 | #206 | Fair $83,068 |
| Dutch | 20.3 /100 | #207 | Fair $82,971 |