Albanian vs Welsh Unemployment Among Ages 35 to 44 years
COMPARE
Albanian
Welsh
Unemployment Among Ages 35 to 44 years
Unemployment Among Ages 35 to 44 years Comparison
Albanians
Welsh
4.6%
UNEMPLOYMENT AMONG AGES 35 TO 44 YEARS
63.0/ 100
METRIC RATING
159th/ 347
METRIC RANK
4.5%
UNEMPLOYMENT AMONG AGES 35 TO 44 YEARS
91.6/ 100
METRIC RATING
103rd/ 347
METRIC RANK
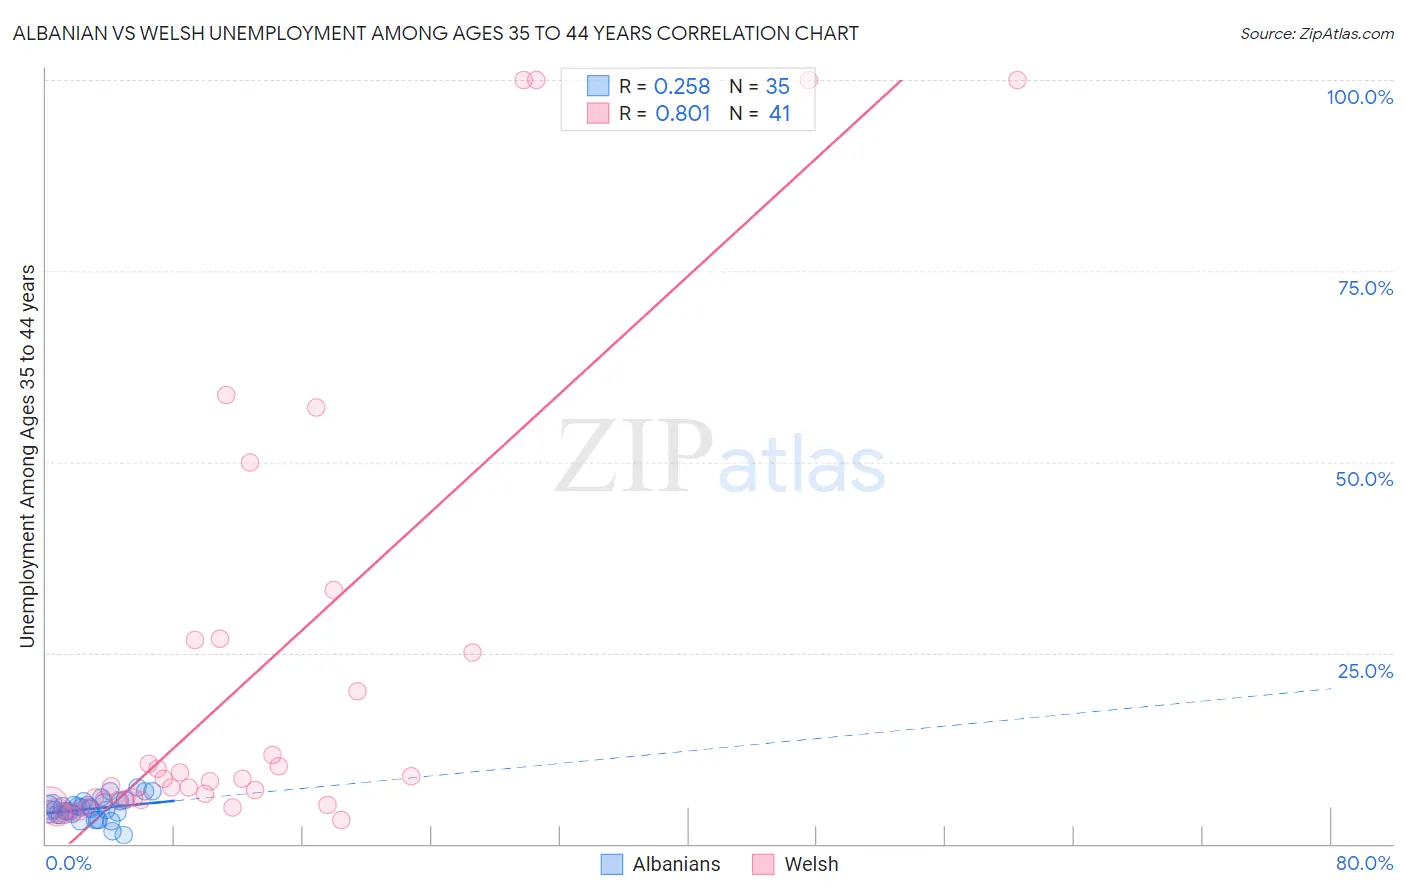
Albanian vs Welsh Unemployment Among Ages 35 to 44 years Correlation Chart
The statistical analysis conducted on geographies consisting of 190,928,836 people shows a weak positive correlation between the proportion of Albanians and unemployment rate among population between the ages 35 and 44 in the United States with a correlation coefficient (R) of 0.258 and weighted average of 4.6%. Similarly, the statistical analysis conducted on geographies consisting of 498,709,039 people shows a very strong positive correlation between the proportion of Welsh and unemployment rate among population between the ages 35 and 44 in the United States with a correlation coefficient (R) of 0.801 and weighted average of 4.5%, a difference of 3.4%.
Unemployment Among Ages 35 to 44 years Correlation Summary
| Measurement | Albanian | Welsh |
| Minimum | 1.1% | 3.1% |
| Maximum | 7.3% | 100.0% |
| Range | 6.2% | 96.9% |
| Mean | 4.6% | 21.8% |
| Median | 4.5% | 8.2% |
| Interquartile 25% (IQ1) | 3.9% | 5.7% |
| Interquartile 75% (IQ3) | 5.3% | 25.8% |
| Interquartile Range (IQR) | 1.5% | 20.1% |
| Standard Deviation (Sample) | 1.4% | 29.5% |
| Standard Deviation (Population) | 1.4% | 29.1% |
Similar Demographics by Unemployment Among Ages 35 to 44 years
Demographics Similar to Albanians by Unemployment Among Ages 35 to 44 years
In terms of unemployment among ages 35 to 44 years, the demographic groups most similar to Albanians are Immigrants from Iran (4.6%, a difference of 0.010%), Immigrants from Belarus (4.6%, a difference of 0.030%), Hungarian (4.6%, a difference of 0.030%), South American (4.6%, a difference of 0.050%), and Celtic (4.7%, a difference of 0.10%).
| Demographics | Rating | Rank | Unemployment Among Ages 35 to 44 years |
| Pakistanis | 67.1 /100 | #152 | Good 4.6% |
| Immigrants | Brazil | 67.0 /100 | #153 | Good 4.6% |
| Immigrants | Western Europe | 65.5 /100 | #154 | Good 4.6% |
| Whites/Caucasians | 64.9 /100 | #155 | Good 4.6% |
| South Americans | 63.7 /100 | #156 | Good 4.6% |
| Immigrants | Belarus | 63.4 /100 | #157 | Good 4.6% |
| Immigrants | Iran | 63.1 /100 | #158 | Good 4.6% |
| Albanians | 63.0 /100 | #159 | Good 4.6% |
| Hungarians | 62.6 /100 | #160 | Good 4.6% |
| Celtics | 61.7 /100 | #161 | Good 4.7% |
| Costa Ricans | 59.6 /100 | #162 | Average 4.7% |
| South Africans | 58.5 /100 | #163 | Average 4.7% |
| Immigrants | Morocco | 57.2 /100 | #164 | Average 4.7% |
| German Russians | 57.2 /100 | #165 | Average 4.7% |
| French | 55.6 /100 | #166 | Average 4.7% |
Demographics Similar to Welsh by Unemployment Among Ages 35 to 44 years
In terms of unemployment among ages 35 to 44 years, the demographic groups most similar to Welsh are Finnish (4.5%, a difference of 0.020%), Immigrants from Sudan (4.5%, a difference of 0.030%), Immigrants from Netherlands (4.5%, a difference of 0.060%), Italian (4.5%, a difference of 0.070%), and Immigrants from Saudi Arabia (4.5%, a difference of 0.080%).
| Demographics | Rating | Rank | Unemployment Among Ages 35 to 44 years |
| Scottish | 93.5 /100 | #96 | Exceptional 4.5% |
| Immigrants | France | 92.5 /100 | #97 | Exceptional 4.5% |
| Immigrants | Canada | 92.3 /100 | #98 | Exceptional 4.5% |
| Immigrants | Egypt | 92.3 /100 | #99 | Exceptional 4.5% |
| Italians | 91.9 /100 | #100 | Exceptional 4.5% |
| Immigrants | Netherlands | 91.9 /100 | #101 | Exceptional 4.5% |
| Immigrants | Sudan | 91.8 /100 | #102 | Exceptional 4.5% |
| Welsh | 91.6 /100 | #103 | Exceptional 4.5% |
| Finns | 91.6 /100 | #104 | Exceptional 4.5% |
| Immigrants | Saudi Arabia | 91.3 /100 | #105 | Exceptional 4.5% |
| Immigrants | North America | 91.1 /100 | #106 | Exceptional 4.5% |
| Immigrants | North Macedonia | 90.7 /100 | #107 | Exceptional 4.5% |
| New Zealanders | 90.3 /100 | #108 | Exceptional 4.5% |
| Romanians | 90.3 /100 | #109 | Exceptional 4.5% |
| Immigrants | Kazakhstan | 90.0 /100 | #110 | Excellent 4.5% |