Aleut vs Welsh Median Earnings
COMPARE
Aleut
Welsh
Median Earnings
Median Earnings Comparison
Aleuts
Welsh
$44,241
MEDIAN EARNINGS
4.4/ 100
METRIC RATING
240th/ 347
METRIC RANK
$45,710
MEDIAN EARNINGS
26.6/ 100
METRIC RATING
203rd/ 347
METRIC RANK
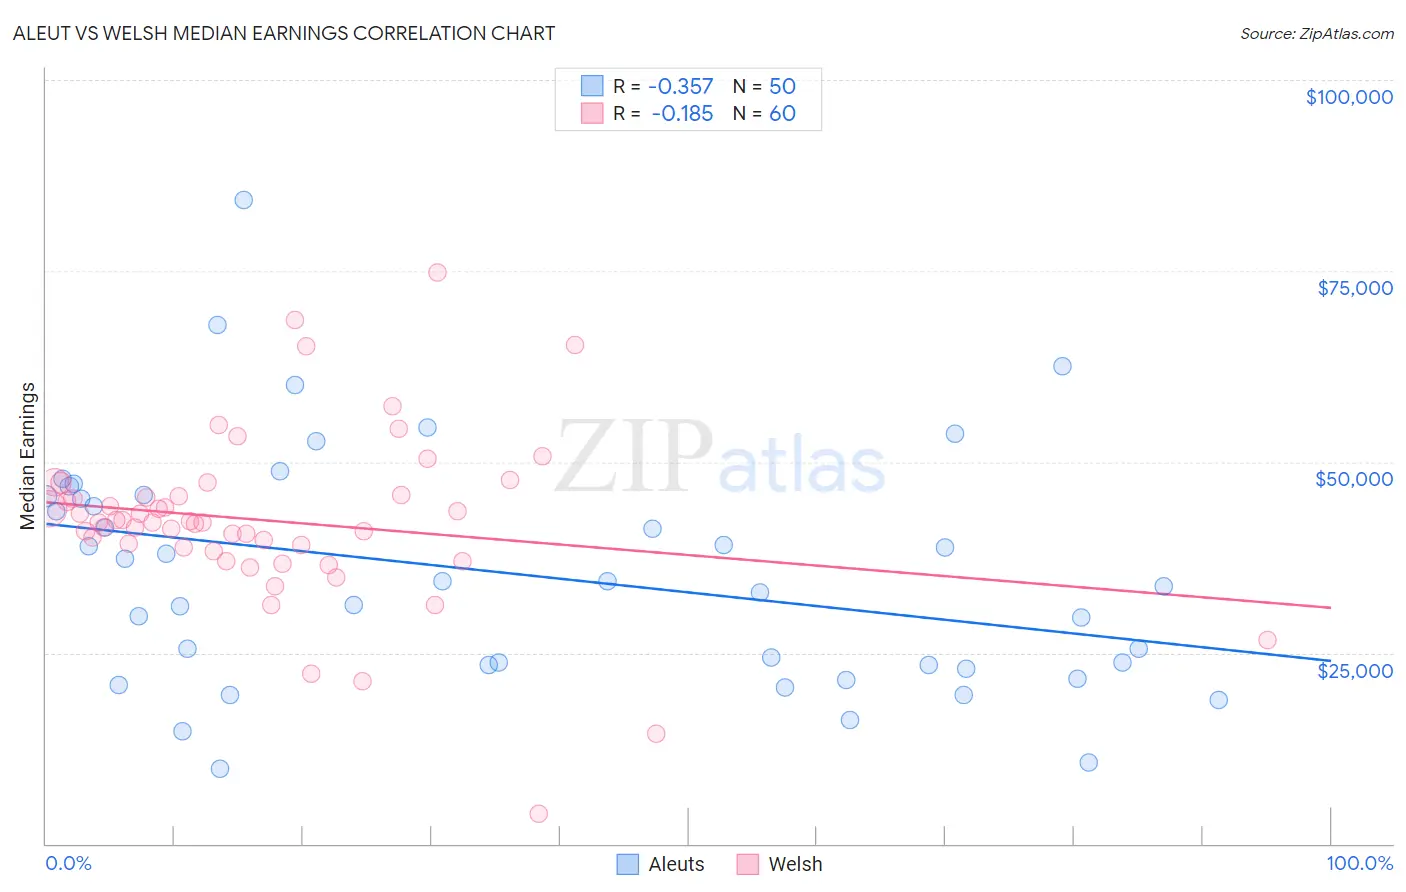
Aleut vs Welsh Median Earnings Correlation Chart
The statistical analysis conducted on geographies consisting of 61,772,931 people shows a mild negative correlation between the proportion of Aleuts and median earnings in the United States with a correlation coefficient (R) of -0.357 and weighted average of $44,241. Similarly, the statistical analysis conducted on geographies consisting of 528,402,039 people shows a poor negative correlation between the proportion of Welsh and median earnings in the United States with a correlation coefficient (R) of -0.185 and weighted average of $45,710, a difference of 3.3%.
Median Earnings Correlation Summary
| Measurement | Aleut | Welsh |
| Minimum | $9,792 | $3,902 |
| Maximum | $84,286 | $74,844 |
| Range | $74,494 | $70,942 |
| Mean | $35,360 | $42,284 |
| Median | $34,021 | $42,106 |
| Interquartile 25% (IQ1) | $23,409 | $38,560 |
| Interquartile 75% (IQ3) | $45,452 | $45,605 |
| Interquartile Range (IQR) | $22,043 | $7,045 |
| Standard Deviation (Sample) | $15,491 | $11,412 |
| Standard Deviation (Population) | $15,336 | $11,316 |
Similar Demographics by Median Earnings
Demographics Similar to Aleuts by Median Earnings
In terms of median earnings, the demographic groups most similar to Aleuts are Samoan ($44,206, a difference of 0.080%), Immigrants from Venezuela ($44,163, a difference of 0.18%), Subsaharan African ($44,118, a difference of 0.28%), Nonimmigrants ($44,117, a difference of 0.28%), and Senegalese ($44,373, a difference of 0.30%).
| Demographics | Rating | Rank | Median Earnings |
| Immigrants | Sudan | 8.8 /100 | #233 | Tragic $44,767 |
| Cape Verdeans | 7.5 /100 | #234 | Tragic $44,640 |
| Venezuelans | 6.9 /100 | #235 | Tragic $44,580 |
| British West Indians | 6.7 /100 | #236 | Tragic $44,552 |
| Immigrants | Ecuador | 5.9 /100 | #237 | Tragic $44,462 |
| Sudanese | 5.6 /100 | #238 | Tragic $44,419 |
| Senegalese | 5.3 /100 | #239 | Tragic $44,373 |
| Aleuts | 4.4 /100 | #240 | Tragic $44,241 |
| Samoans | 4.2 /100 | #241 | Tragic $44,206 |
| Immigrants | Venezuela | 4.0 /100 | #242 | Tragic $44,163 |
| Sub-Saharan Africans | 3.7 /100 | #243 | Tragic $44,118 |
| Immigrants | Nonimmigrants | 3.7 /100 | #244 | Tragic $44,117 |
| Immigrants | Burma/Myanmar | 3.2 /100 | #245 | Tragic $43,998 |
| Immigrants | West Indies | 3.1 /100 | #246 | Tragic $43,989 |
| Immigrants | Cabo Verde | 3.0 /100 | #247 | Tragic $43,963 |
Demographics Similar to Welsh by Median Earnings
In terms of median earnings, the demographic groups most similar to Welsh are Immigrants from Trinidad and Tobago ($45,729, a difference of 0.040%), Celtic ($45,732, a difference of 0.050%), Immigrants from Uruguay ($45,682, a difference of 0.060%), Tongan ($45,665, a difference of 0.10%), and Immigrants from Ghana ($45,641, a difference of 0.15%).
| Demographics | Rating | Rank | Median Earnings |
| Yugoslavians | 30.5 /100 | #196 | Fair $45,846 |
| Barbadians | 30.5 /100 | #197 | Fair $45,846 |
| Trinidadians and Tobagonians | 29.7 /100 | #198 | Fair $45,820 |
| Immigrants | Barbados | 29.6 /100 | #199 | Fair $45,816 |
| Immigrants | Azores | 29.5 /100 | #200 | Fair $45,812 |
| Celtics | 27.2 /100 | #201 | Fair $45,732 |
| Immigrants | Trinidad and Tobago | 27.1 /100 | #202 | Fair $45,729 |
| Welsh | 26.6 /100 | #203 | Fair $45,710 |
| Immigrants | Uruguay | 25.9 /100 | #204 | Fair $45,682 |
| Tongans | 25.4 /100 | #205 | Fair $45,665 |
| Immigrants | Ghana | 24.8 /100 | #206 | Fair $45,641 |
| Immigrants | Senegal | 24.0 /100 | #207 | Fair $45,611 |
| Immigrants | Bosnia and Herzegovina | 23.7 /100 | #208 | Fair $45,600 |
| Immigrants | Thailand | 23.7 /100 | #209 | Fair $45,598 |
| Immigrants | Grenada | 23.6 /100 | #210 | Fair $45,596 |