Albanian vs Welsh Child Poverty Under the Age of 5
COMPARE
Albanian
Welsh
Child Poverty Under the Age of 5
Child Poverty Under the Age of 5 Comparison
Albanians
Welsh
16.0%
CHILD POVERTY UNDER THE AGE OF 5
93.8/ 100
METRIC RATING
115th/ 347
METRIC RANK
17.2%
CHILD POVERTY UNDER THE AGE OF 5
54.0/ 100
METRIC RATING
173rd/ 347
METRIC RANK
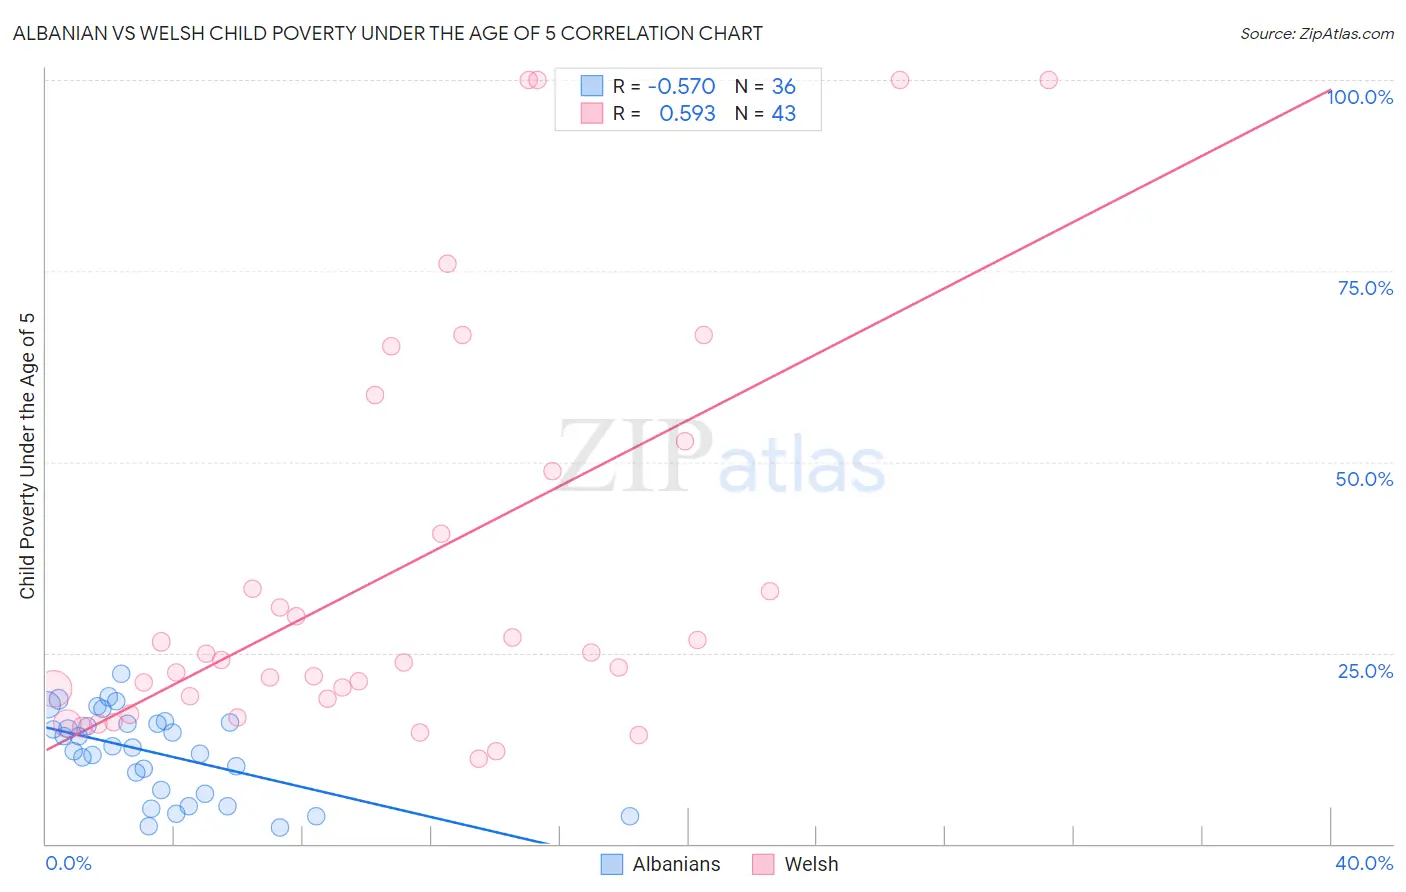
Albanian vs Welsh Child Poverty Under the Age of 5 Correlation Chart
The statistical analysis conducted on geographies consisting of 186,792,170 people shows a substantial negative correlation between the proportion of Albanians and poverty level among children under the age of 5 in the United States with a correlation coefficient (R) of -0.570 and weighted average of 16.0%. Similarly, the statistical analysis conducted on geographies consisting of 495,489,494 people shows a substantial positive correlation between the proportion of Welsh and poverty level among children under the age of 5 in the United States with a correlation coefficient (R) of 0.593 and weighted average of 17.2%, a difference of 7.1%.
Child Poverty Under the Age of 5 Correlation Summary
| Measurement | Albanian | Welsh |
| Minimum | 2.1% | 11.2% |
| Maximum | 22.2% | 100.0% |
| Range | 20.1% | 88.8% |
| Mean | 11.9% | 35.8% |
| Median | 12.6% | 24.0% |
| Interquartile 25% (IQ1) | 6.8% | 19.0% |
| Interquartile 75% (IQ3) | 15.8% | 48.8% |
| Interquartile Range (IQR) | 9.0% | 29.8% |
| Standard Deviation (Sample) | 5.6% | 26.4% |
| Standard Deviation (Population) | 5.5% | 26.1% |
Similar Demographics by Child Poverty Under the Age of 5
Demographics Similar to Albanians by Child Poverty Under the Age of 5
In terms of child poverty under the age of 5, the demographic groups most similar to Albanians are Immigrants from Kuwait (16.0%, a difference of 0.020%), Puget Sound Salish (16.0%, a difference of 0.11%), Peruvian (16.0%, a difference of 0.12%), Pakistani (16.0%, a difference of 0.17%), and Immigrants from Austria (16.0%, a difference of 0.17%).
| Demographics | Rating | Rank | Child Poverty Under the Age of 5 |
| Immigrants | Brazil | 94.4 /100 | #108 | Exceptional 16.0% |
| Northern Europeans | 94.3 /100 | #109 | Exceptional 16.0% |
| Romanians | 94.3 /100 | #110 | Exceptional 16.0% |
| Pakistanis | 94.2 /100 | #111 | Exceptional 16.0% |
| Peruvians | 94.1 /100 | #112 | Exceptional 16.0% |
| Puget Sound Salish | 94.1 /100 | #113 | Exceptional 16.0% |
| Immigrants | Kuwait | 93.9 /100 | #114 | Exceptional 16.0% |
| Albanians | 93.8 /100 | #115 | Exceptional 16.0% |
| Immigrants | Austria | 93.5 /100 | #116 | Exceptional 16.0% |
| Basques | 93.4 /100 | #117 | Exceptional 16.0% |
| Immigrants | Denmark | 93.4 /100 | #118 | Exceptional 16.0% |
| Immigrants | Jordan | 93.2 /100 | #119 | Exceptional 16.1% |
| Immigrants | Peru | 92.6 /100 | #120 | Exceptional 16.1% |
| Mongolians | 92.5 /100 | #121 | Exceptional 16.1% |
| Immigrants | Southern Europe | 92.0 /100 | #122 | Exceptional 16.1% |
Demographics Similar to Welsh by Child Poverty Under the Age of 5
In terms of child poverty under the age of 5, the demographic groups most similar to Welsh are Yugoslavian (17.2%, a difference of 0.010%), Immigrants from Saudi Arabia (17.2%, a difference of 0.42%), Immigrants from Morocco (17.1%, a difference of 0.53%), Immigrants from Western Asia (17.1%, a difference of 0.56%), and Immigrants from South America (17.1%, a difference of 0.65%).
| Demographics | Rating | Rank | Child Poverty Under the Age of 5 |
| Slavs | 64.0 /100 | #166 | Good 17.0% |
| Immigrants | Uzbekistan | 62.0 /100 | #167 | Good 17.0% |
| Uruguayans | 60.5 /100 | #168 | Good 17.0% |
| Immigrants | South America | 60.0 /100 | #169 | Good 17.1% |
| Immigrants | Western Asia | 59.2 /100 | #170 | Average 17.1% |
| Immigrants | Morocco | 58.9 /100 | #171 | Average 17.1% |
| Yugoslavians | 54.1 /100 | #172 | Average 17.2% |
| Welsh | 54.0 /100 | #173 | Average 17.2% |
| Immigrants | Saudi Arabia | 50.0 /100 | #174 | Average 17.2% |
| Immigrants | Lebanon | 47.6 /100 | #175 | Average 17.3% |
| Immigrants | Iraq | 45.2 /100 | #176 | Average 17.3% |
| Immigrants | Sierra Leone | 43.6 /100 | #177 | Average 17.3% |
| Immigrants | Cameroon | 42.7 /100 | #178 | Average 17.4% |
| Hawaiians | 41.5 /100 | #179 | Average 17.4% |
| South American Indians | 41.4 /100 | #180 | Average 17.4% |