South American Indian vs Welsh Median Earnings
COMPARE
South American Indian
Welsh
Median Earnings
Median Earnings Comparison
South American Indians
Welsh
$46,952
MEDIAN EARNINGS
67.4/ 100
METRIC RATING
162nd/ 347
METRIC RANK
$45,710
MEDIAN EARNINGS
26.6/ 100
METRIC RATING
203rd/ 347
METRIC RANK
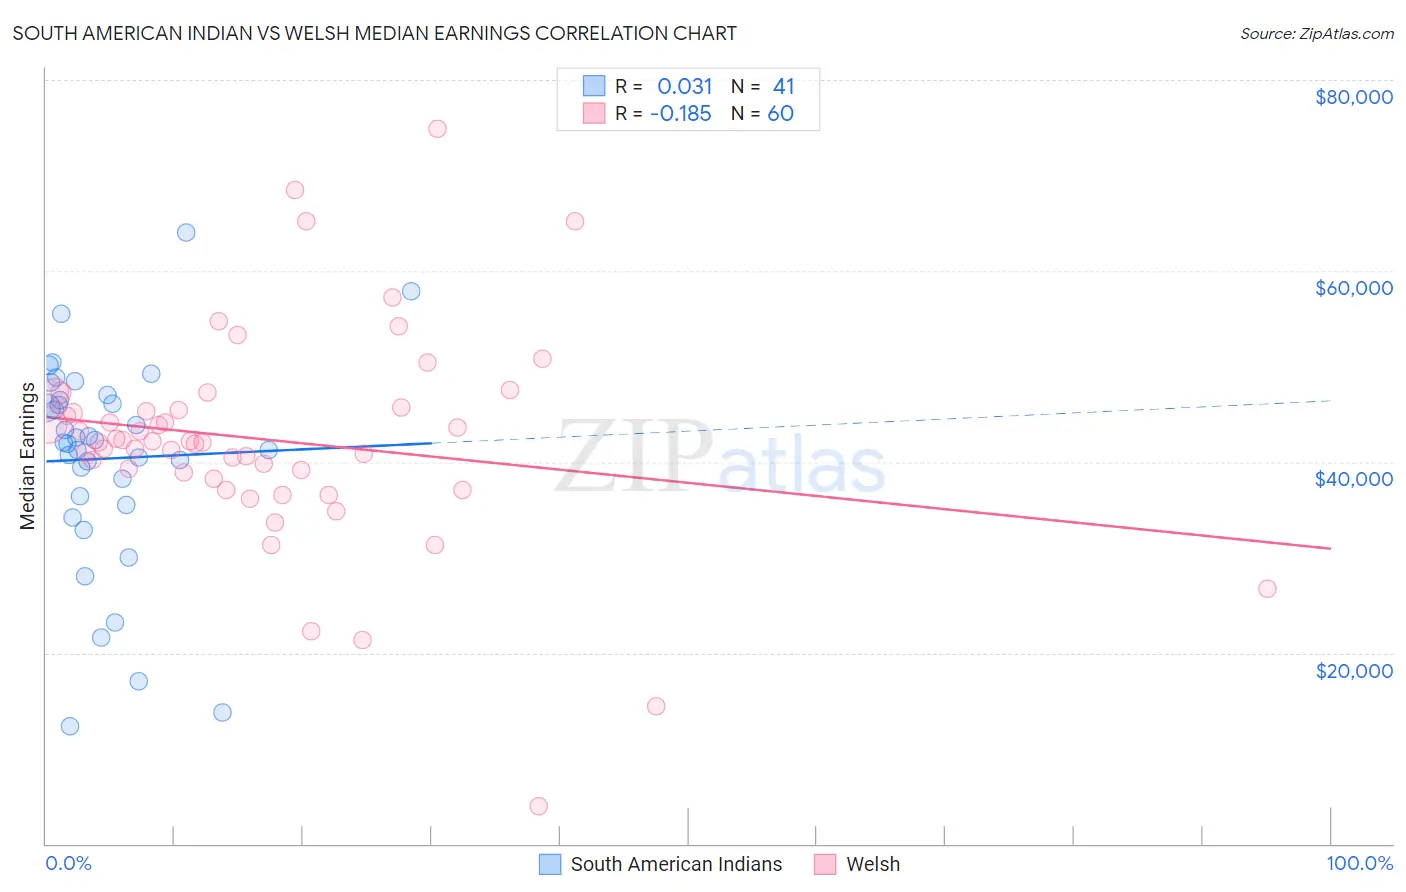
South American Indian vs Welsh Median Earnings Correlation Chart
The statistical analysis conducted on geographies consisting of 164,566,845 people shows no correlation between the proportion of South American Indians and median earnings in the United States with a correlation coefficient (R) of 0.031 and weighted average of $46,952. Similarly, the statistical analysis conducted on geographies consisting of 528,402,039 people shows a poor negative correlation between the proportion of Welsh and median earnings in the United States with a correlation coefficient (R) of -0.185 and weighted average of $45,710, a difference of 2.7%.
Median Earnings Correlation Summary
| Measurement | South American Indian | Welsh |
| Minimum | $12,289 | $3,902 |
| Maximum | $64,091 | $74,844 |
| Range | $51,802 | $70,942 |
| Mean | $40,352 | $42,284 |
| Median | $41,992 | $42,106 |
| Interquartile 25% (IQ1) | $35,978 | $38,560 |
| Interquartile 75% (IQ3) | $46,744 | $45,605 |
| Interquartile Range (IQR) | $10,766 | $7,045 |
| Standard Deviation (Sample) | $11,075 | $11,412 |
| Standard Deviation (Population) | $10,940 | $11,316 |
Similar Demographics by Median Earnings
Demographics Similar to South American Indians by Median Earnings
In terms of median earnings, the demographic groups most similar to South American Indians are Immigrants from Eastern Africa ($46,969, a difference of 0.040%), Icelander ($46,916, a difference of 0.080%), Alsatian ($47,023, a difference of 0.15%), Immigrants from Peru ($47,025, a difference of 0.16%), and Norwegian ($46,865, a difference of 0.18%).
| Demographics | Rating | Rank | Median Earnings |
| Immigrants | Vietnam | 76.7 /100 | #155 | Good $47,282 |
| Irish | 76.6 /100 | #156 | Good $47,276 |
| Czechs | 75.1 /100 | #157 | Good $47,221 |
| Slovaks | 71.7 /100 | #158 | Good $47,095 |
| Immigrants | Peru | 69.6 /100 | #159 | Good $47,025 |
| Alsatians | 69.6 /100 | #160 | Good $47,023 |
| Immigrants | Eastern Africa | 68.0 /100 | #161 | Good $46,969 |
| South American Indians | 67.4 /100 | #162 | Good $46,952 |
| Icelanders | 66.3 /100 | #163 | Good $46,916 |
| Norwegians | 64.7 /100 | #164 | Good $46,865 |
| South Americans | 62.7 /100 | #165 | Good $46,804 |
| Czechoslovakians | 57.8 /100 | #166 | Average $46,658 |
| Costa Ricans | 57.4 /100 | #167 | Average $46,645 |
| Immigrants | Africa | 54.6 /100 | #168 | Average $46,564 |
| Immigrants | South America | 54.0 /100 | #169 | Average $46,548 |
Demographics Similar to Welsh by Median Earnings
In terms of median earnings, the demographic groups most similar to Welsh are Immigrants from Trinidad and Tobago ($45,729, a difference of 0.040%), Celtic ($45,732, a difference of 0.050%), Immigrants from Uruguay ($45,682, a difference of 0.060%), Tongan ($45,665, a difference of 0.10%), and Immigrants from Ghana ($45,641, a difference of 0.15%).
| Demographics | Rating | Rank | Median Earnings |
| Yugoslavians | 30.5 /100 | #196 | Fair $45,846 |
| Barbadians | 30.5 /100 | #197 | Fair $45,846 |
| Trinidadians and Tobagonians | 29.7 /100 | #198 | Fair $45,820 |
| Immigrants | Barbados | 29.6 /100 | #199 | Fair $45,816 |
| Immigrants | Azores | 29.5 /100 | #200 | Fair $45,812 |
| Celtics | 27.2 /100 | #201 | Fair $45,732 |
| Immigrants | Trinidad and Tobago | 27.1 /100 | #202 | Fair $45,729 |
| Welsh | 26.6 /100 | #203 | Fair $45,710 |
| Immigrants | Uruguay | 25.9 /100 | #204 | Fair $45,682 |
| Tongans | 25.4 /100 | #205 | Fair $45,665 |
| Immigrants | Ghana | 24.8 /100 | #206 | Fair $45,641 |
| Immigrants | Senegal | 24.0 /100 | #207 | Fair $45,611 |
| Immigrants | Bosnia and Herzegovina | 23.7 /100 | #208 | Fair $45,600 |
| Immigrants | Thailand | 23.7 /100 | #209 | Fair $45,598 |
| Immigrants | Grenada | 23.6 /100 | #210 | Fair $45,596 |