Immigrants from Cabo Verde vs Welsh Median Earnings
COMPARE
Immigrants from Cabo Verde
Welsh
Median Earnings
Median Earnings Comparison
Immigrants from Cabo Verde
Welsh
$43,963
MEDIAN EARNINGS
3.0/ 100
METRIC RATING
247th/ 347
METRIC RANK
$45,710
MEDIAN EARNINGS
26.6/ 100
METRIC RATING
203rd/ 347
METRIC RANK
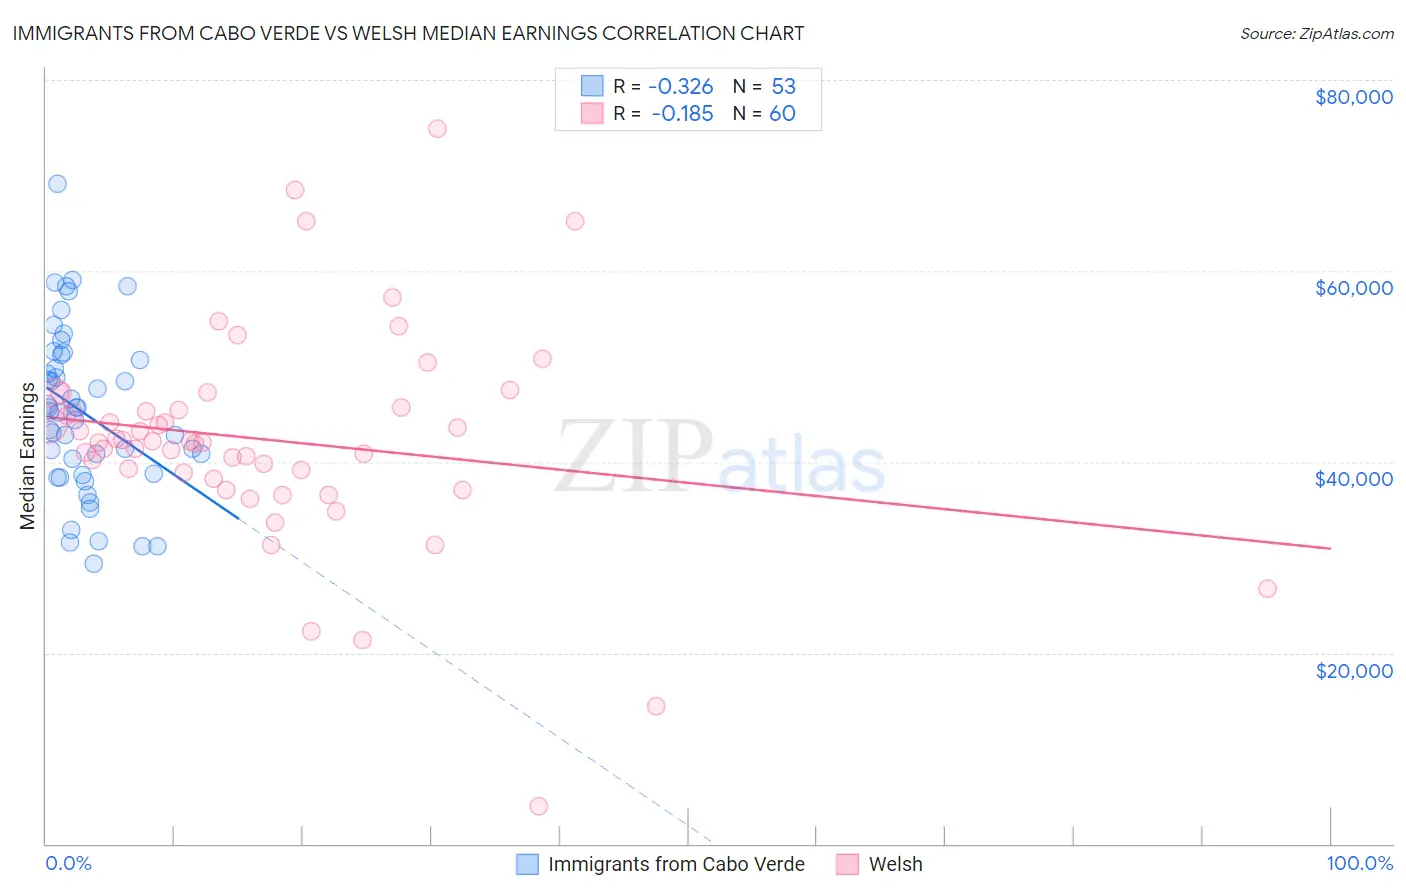
Immigrants from Cabo Verde vs Welsh Median Earnings Correlation Chart
The statistical analysis conducted on geographies consisting of 38,158,666 people shows a mild negative correlation between the proportion of Immigrants from Cabo Verde and median earnings in the United States with a correlation coefficient (R) of -0.326 and weighted average of $43,963. Similarly, the statistical analysis conducted on geographies consisting of 528,402,039 people shows a poor negative correlation between the proportion of Welsh and median earnings in the United States with a correlation coefficient (R) of -0.185 and weighted average of $45,710, a difference of 4.0%.
Median Earnings Correlation Summary
| Measurement | Immigrants from Cabo Verde | Welsh |
| Minimum | $29,297 | $3,902 |
| Maximum | $69,097 | $74,844 |
| Range | $39,800 | $70,942 |
| Mean | $45,169 | $42,284 |
| Median | $45,280 | $42,106 |
| Interquartile 25% (IQ1) | $38,744 | $38,560 |
| Interquartile 75% (IQ3) | $50,961 | $45,605 |
| Interquartile Range (IQR) | $12,217 | $7,045 |
| Standard Deviation (Sample) | $8,556 | $11,412 |
| Standard Deviation (Population) | $8,475 | $11,316 |
Similar Demographics by Median Earnings
Demographics Similar to Immigrants from Cabo Verde by Median Earnings
In terms of median earnings, the demographic groups most similar to Immigrants from Cabo Verde are Immigrants from West Indies ($43,989, a difference of 0.060%), Immigrants from Burma/Myanmar ($43,998, a difference of 0.080%), Nepalese ($43,860, a difference of 0.24%), Malaysian ($43,844, a difference of 0.27%), and Subsaharan African ($44,118, a difference of 0.35%).
| Demographics | Rating | Rank | Median Earnings |
| Aleuts | 4.4 /100 | #240 | Tragic $44,241 |
| Samoans | 4.2 /100 | #241 | Tragic $44,206 |
| Immigrants | Venezuela | 4.0 /100 | #242 | Tragic $44,163 |
| Sub-Saharan Africans | 3.7 /100 | #243 | Tragic $44,118 |
| Immigrants | Nonimmigrants | 3.7 /100 | #244 | Tragic $44,117 |
| Immigrants | Burma/Myanmar | 3.2 /100 | #245 | Tragic $43,998 |
| Immigrants | West Indies | 3.1 /100 | #246 | Tragic $43,989 |
| Immigrants | Cabo Verde | 3.0 /100 | #247 | Tragic $43,963 |
| Nepalese | 2.6 /100 | #248 | Tragic $43,860 |
| Malaysians | 2.6 /100 | #249 | Tragic $43,844 |
| Alaska Natives | 2.3 /100 | #250 | Tragic $43,750 |
| Tsimshian | 2.1 /100 | #251 | Tragic $43,695 |
| Hawaiians | 2.0 /100 | #252 | Tragic $43,673 |
| Somalis | 1.8 /100 | #253 | Tragic $43,567 |
| Liberians | 1.7 /100 | #254 | Tragic $43,536 |
Demographics Similar to Welsh by Median Earnings
In terms of median earnings, the demographic groups most similar to Welsh are Immigrants from Trinidad and Tobago ($45,729, a difference of 0.040%), Celtic ($45,732, a difference of 0.050%), Immigrants from Uruguay ($45,682, a difference of 0.060%), Tongan ($45,665, a difference of 0.10%), and Immigrants from Ghana ($45,641, a difference of 0.15%).
| Demographics | Rating | Rank | Median Earnings |
| Yugoslavians | 30.5 /100 | #196 | Fair $45,846 |
| Barbadians | 30.5 /100 | #197 | Fair $45,846 |
| Trinidadians and Tobagonians | 29.7 /100 | #198 | Fair $45,820 |
| Immigrants | Barbados | 29.6 /100 | #199 | Fair $45,816 |
| Immigrants | Azores | 29.5 /100 | #200 | Fair $45,812 |
| Celtics | 27.2 /100 | #201 | Fair $45,732 |
| Immigrants | Trinidad and Tobago | 27.1 /100 | #202 | Fair $45,729 |
| Welsh | 26.6 /100 | #203 | Fair $45,710 |
| Immigrants | Uruguay | 25.9 /100 | #204 | Fair $45,682 |
| Tongans | 25.4 /100 | #205 | Fair $45,665 |
| Immigrants | Ghana | 24.8 /100 | #206 | Fair $45,641 |
| Immigrants | Senegal | 24.0 /100 | #207 | Fair $45,611 |
| Immigrants | Bosnia and Herzegovina | 23.7 /100 | #208 | Fair $45,600 |
| Immigrants | Thailand | 23.7 /100 | #209 | Fair $45,598 |
| Immigrants | Grenada | 23.6 /100 | #210 | Fair $45,596 |