Albanian vs Immigrants from Uruguay Median Male Earnings
COMPARE
Albanian
Immigrants from Uruguay
Median Male Earnings
Median Male Earnings Comparison
Albanians
Immigrants from Uruguay
$58,680
MEDIAN MALE EARNINGS
98.4/ 100
METRIC RATING
96th/ 347
METRIC RANK
$52,860
MEDIAN MALE EARNINGS
16.8/ 100
METRIC RATING
202nd/ 347
METRIC RANK
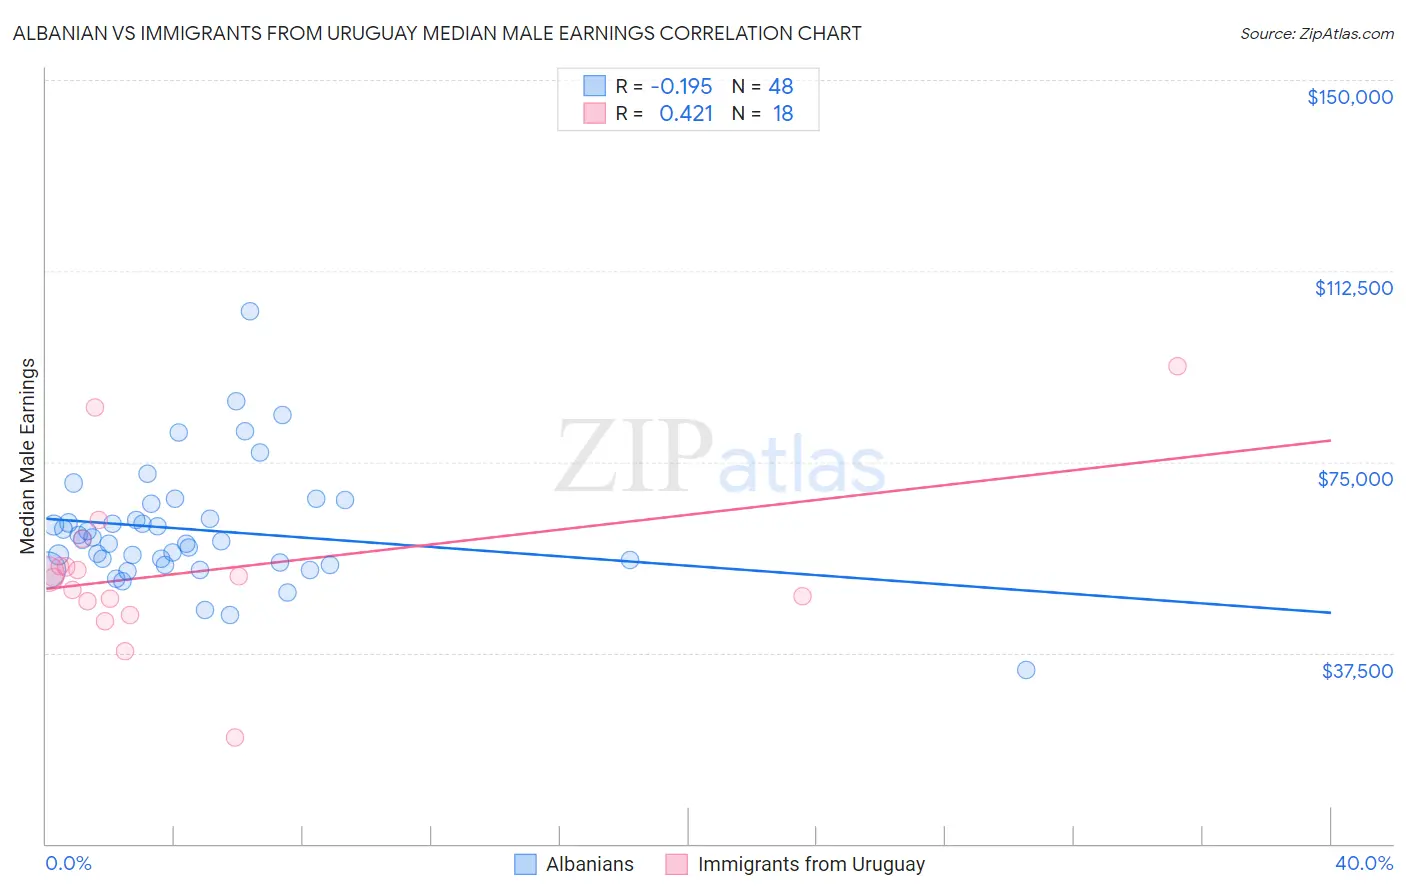
Albanian vs Immigrants from Uruguay Median Male Earnings Correlation Chart
The statistical analysis conducted on geographies consisting of 193,234,421 people shows a poor negative correlation between the proportion of Albanians and median male earnings in the United States with a correlation coefficient (R) of -0.195 and weighted average of $58,680. Similarly, the statistical analysis conducted on geographies consisting of 133,249,563 people shows a moderate positive correlation between the proportion of Immigrants from Uruguay and median male earnings in the United States with a correlation coefficient (R) of 0.421 and weighted average of $52,860, a difference of 11.0%.
Median Male Earnings Correlation Summary
| Measurement | Albanian | Immigrants from Uruguay |
| Minimum | $34,079 | $20,946 |
| Maximum | $104,479 | $93,710 |
| Range | $70,400 | $72,764 |
| Mean | $61,666 | $53,632 |
| Median | $59,610 | $52,453 |
| Interquartile 25% (IQ1) | $54,972 | $47,598 |
| Interquartile 75% (IQ3) | $65,262 | $54,536 |
| Interquartile Range (IQR) | $10,290 | $6,938 |
| Standard Deviation (Sample) | $11,807 | $16,044 |
| Standard Deviation (Population) | $11,684 | $15,592 |
Similar Demographics by Median Male Earnings
Demographics Similar to Albanians by Median Male Earnings
In terms of median male earnings, the demographic groups most similar to Albanians are Northern European ($58,588, a difference of 0.16%), Immigrants from Lebanon ($58,835, a difference of 0.27%), Jordanian ($58,500, a difference of 0.31%), Immigrants from Poland ($58,452, a difference of 0.39%), and Assyrian/Chaldean/Syriac ($58,437, a difference of 0.42%).
| Demographics | Rating | Rank | Median Male Earnings |
| Immigrants | Moldova | 99.2 /100 | #89 | Exceptional $59,417 |
| Austrians | 99.2 /100 | #90 | Exceptional $59,359 |
| Laotians | 99.2 /100 | #91 | Exceptional $59,351 |
| Immigrants | Kazakhstan | 99.1 /100 | #92 | Exceptional $59,278 |
| Immigrants | Southern Europe | 99.0 /100 | #93 | Exceptional $59,217 |
| Immigrants | North Macedonia | 99.0 /100 | #94 | Exceptional $59,189 |
| Immigrants | Lebanon | 98.6 /100 | #95 | Exceptional $58,835 |
| Albanians | 98.4 /100 | #96 | Exceptional $58,680 |
| Northern Europeans | 98.2 /100 | #97 | Exceptional $58,588 |
| Jordanians | 98.1 /100 | #98 | Exceptional $58,500 |
| Immigrants | Poland | 98.0 /100 | #99 | Exceptional $58,452 |
| Assyrians/Chaldeans/Syriacs | 97.9 /100 | #100 | Exceptional $58,437 |
| Immigrants | Brazil | 97.7 /100 | #101 | Exceptional $58,324 |
| Syrians | 97.4 /100 | #102 | Exceptional $58,187 |
| Poles | 97.3 /100 | #103 | Exceptional $58,139 |
Demographics Similar to Immigrants from Uruguay by Median Male Earnings
In terms of median male earnings, the demographic groups most similar to Immigrants from Uruguay are Immigrants from Bosnia and Herzegovina ($52,869, a difference of 0.020%), Panamanian ($52,835, a difference of 0.050%), Immigrants from Thailand ($52,908, a difference of 0.090%), Ghanaian ($52,810, a difference of 0.10%), and Immigrants from Colombia ($52,725, a difference of 0.26%).
| Demographics | Rating | Rank | Median Male Earnings |
| Immigrants | Azores | 27.5 /100 | #195 | Fair $53,503 |
| Immigrants | Africa | 26.6 /100 | #196 | Fair $53,457 |
| Immigrants | Kenya | 26.0 /100 | #197 | Fair $53,427 |
| Immigrants | Costa Rica | 22.6 /100 | #198 | Fair $53,237 |
| Tongans | 22.3 /100 | #199 | Fair $53,218 |
| Immigrants | Thailand | 17.5 /100 | #200 | Poor $52,908 |
| Immigrants | Bosnia and Herzegovina | 16.9 /100 | #201 | Poor $52,869 |
| Immigrants | Uruguay | 16.8 /100 | #202 | Poor $52,860 |
| Panamanians | 16.5 /100 | #203 | Poor $52,835 |
| Ghanaians | 16.1 /100 | #204 | Poor $52,810 |
| Immigrants | Colombia | 15.0 /100 | #205 | Poor $52,725 |
| Immigrants | Iraq | 14.5 /100 | #206 | Poor $52,681 |
| Vietnamese | 12.7 /100 | #207 | Poor $52,525 |
| Venezuelans | 12.5 /100 | #208 | Poor $52,510 |
| Bermudans | 12.1 /100 | #209 | Poor $52,465 |