Albanian vs Immigrants from Uruguay 11th Grade
COMPARE
Albanian
Immigrants from Uruguay
11th Grade
11th Grade Comparison
Albanians
Immigrants from Uruguay
93.0%
11TH GRADE
89.5/ 100
METRIC RATING
130th/ 347
METRIC RANK
91.3%
11TH GRADE
0.5/ 100
METRIC RATING
262nd/ 347
METRIC RANK
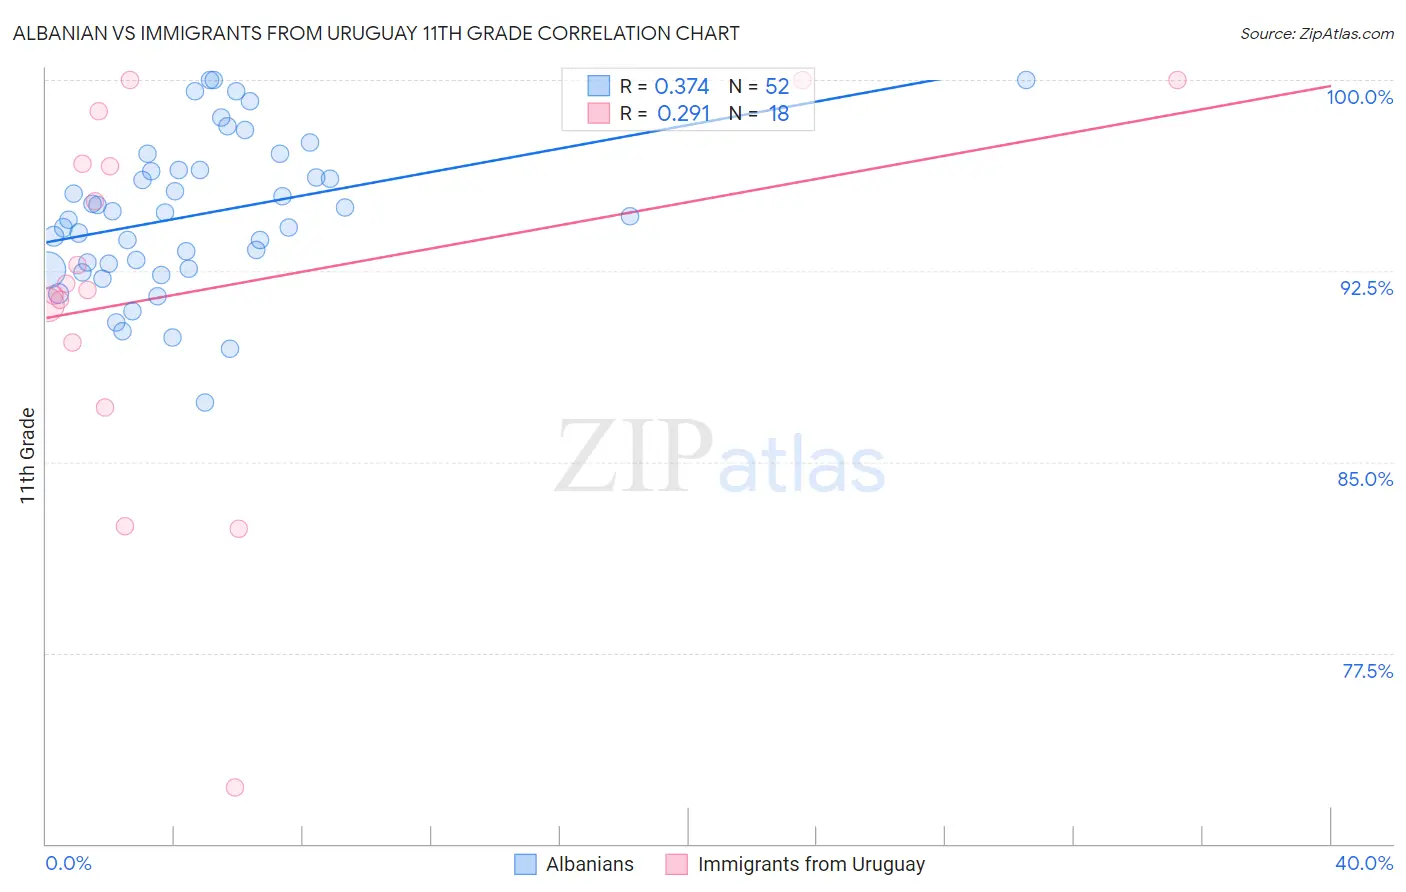
Albanian vs Immigrants from Uruguay 11th Grade Correlation Chart
The statistical analysis conducted on geographies consisting of 193,265,850 people shows a mild positive correlation between the proportion of Albanians and percentage of population with at least 11th grade education in the United States with a correlation coefficient (R) of 0.374 and weighted average of 93.0%. Similarly, the statistical analysis conducted on geographies consisting of 133,259,667 people shows a weak positive correlation between the proportion of Immigrants from Uruguay and percentage of population with at least 11th grade education in the United States with a correlation coefficient (R) of 0.291 and weighted average of 91.3%, a difference of 1.8%.
11th Grade Correlation Summary
| Measurement | Albanian | Immigrants from Uruguay |
| Minimum | 87.4% | 72.2% |
| Maximum | 100.0% | 100.0% |
| Range | 12.6% | 27.8% |
| Mean | 94.7% | 91.8% |
| Median | 94.7% | 91.9% |
| Interquartile 25% (IQ1) | 92.7% | 89.7% |
| Interquartile 75% (IQ3) | 96.5% | 96.7% |
| Interquartile Range (IQR) | 3.8% | 7.0% |
| Standard Deviation (Sample) | 3.0% | 7.3% |
| Standard Deviation (Population) | 2.9% | 7.1% |
Similar Demographics by 11th Grade
Demographics Similar to Albanians by 11th Grade
In terms of 11th grade, the demographic groups most similar to Albanians are Egyptian (93.0%, a difference of 0.0%), Immigrants from Ukraine (93.0%, a difference of 0.010%), Immigrants from Bosnia and Herzegovina (93.0%, a difference of 0.010%), Mongolian (93.0%, a difference of 0.050%), and Delaware (93.0%, a difference of 0.050%).
| Demographics | Rating | Rank | 11th Grade |
| Immigrants | Greece | 95.9 /100 | #123 | Exceptional 93.2% |
| Immigrants | Eastern Europe | 95.9 /100 | #124 | Exceptional 93.2% |
| Immigrants | Sri Lanka | 95.6 /100 | #125 | Exceptional 93.2% |
| Basques | 95.2 /100 | #126 | Exceptional 93.2% |
| Immigrants | Kazakhstan | 92.4 /100 | #127 | Exceptional 93.1% |
| Immigrants | Jordan | 92.4 /100 | #128 | Exceptional 93.1% |
| Immigrants | Ukraine | 89.8 /100 | #129 | Excellent 93.0% |
| Albanians | 89.5 /100 | #130 | Excellent 93.0% |
| Egyptians | 89.5 /100 | #131 | Excellent 93.0% |
| Immigrants | Bosnia and Herzegovina | 89.0 /100 | #132 | Excellent 93.0% |
| Mongolians | 87.6 /100 | #133 | Excellent 93.0% |
| Delaware | 87.3 /100 | #134 | Excellent 93.0% |
| Immigrants | Italy | 86.6 /100 | #135 | Excellent 92.9% |
| Cree | 85.9 /100 | #136 | Excellent 92.9% |
| Arabs | 85.4 /100 | #137 | Excellent 92.9% |
Demographics Similar to Immigrants from Uruguay by 11th Grade
In terms of 11th grade, the demographic groups most similar to Immigrants from Uruguay are Taiwanese (91.3%, a difference of 0.010%), Spanish American (91.4%, a difference of 0.020%), Jamaican (91.4%, a difference of 0.030%), Immigrants from Colombia (91.4%, a difference of 0.040%), and Immigrants from Senegal (91.4%, a difference of 0.060%).
| Demographics | Rating | Rank | 11th Grade |
| Blacks/African Americans | 0.7 /100 | #255 | Tragic 91.4% |
| Immigrants | Senegal | 0.7 /100 | #256 | Tragic 91.4% |
| Cajuns | 0.7 /100 | #257 | Tragic 91.4% |
| Immigrants | Colombia | 0.6 /100 | #258 | Tragic 91.4% |
| Jamaicans | 0.6 /100 | #259 | Tragic 91.4% |
| Spanish Americans | 0.6 /100 | #260 | Tragic 91.4% |
| Taiwanese | 0.6 /100 | #261 | Tragic 91.3% |
| Immigrants | Uruguay | 0.5 /100 | #262 | Tragic 91.3% |
| Immigrants | Ghana | 0.3 /100 | #263 | Tragic 91.2% |
| Yup'ik | 0.3 /100 | #264 | Tragic 91.2% |
| Pueblo | 0.3 /100 | #265 | Tragic 91.2% |
| Immigrants | Western Africa | 0.3 /100 | #266 | Tragic 91.2% |
| Immigrants | Jamaica | 0.3 /100 | #267 | Tragic 91.2% |
| U.S. Virgin Islanders | 0.2 /100 | #268 | Tragic 91.1% |
| Ute | 0.2 /100 | #269 | Tragic 91.1% |