Albanian vs Immigrants from Western Africa Median Male Earnings
COMPARE
Albanian
Immigrants from Western Africa
Median Male Earnings
Median Male Earnings Comparison
Albanians
Immigrants from Western Africa
$58,680
MEDIAN MALE EARNINGS
98.4/ 100
METRIC RATING
96th/ 347
METRIC RANK
$50,940
MEDIAN MALE EARNINGS
3.0/ 100
METRIC RATING
235th/ 347
METRIC RANK
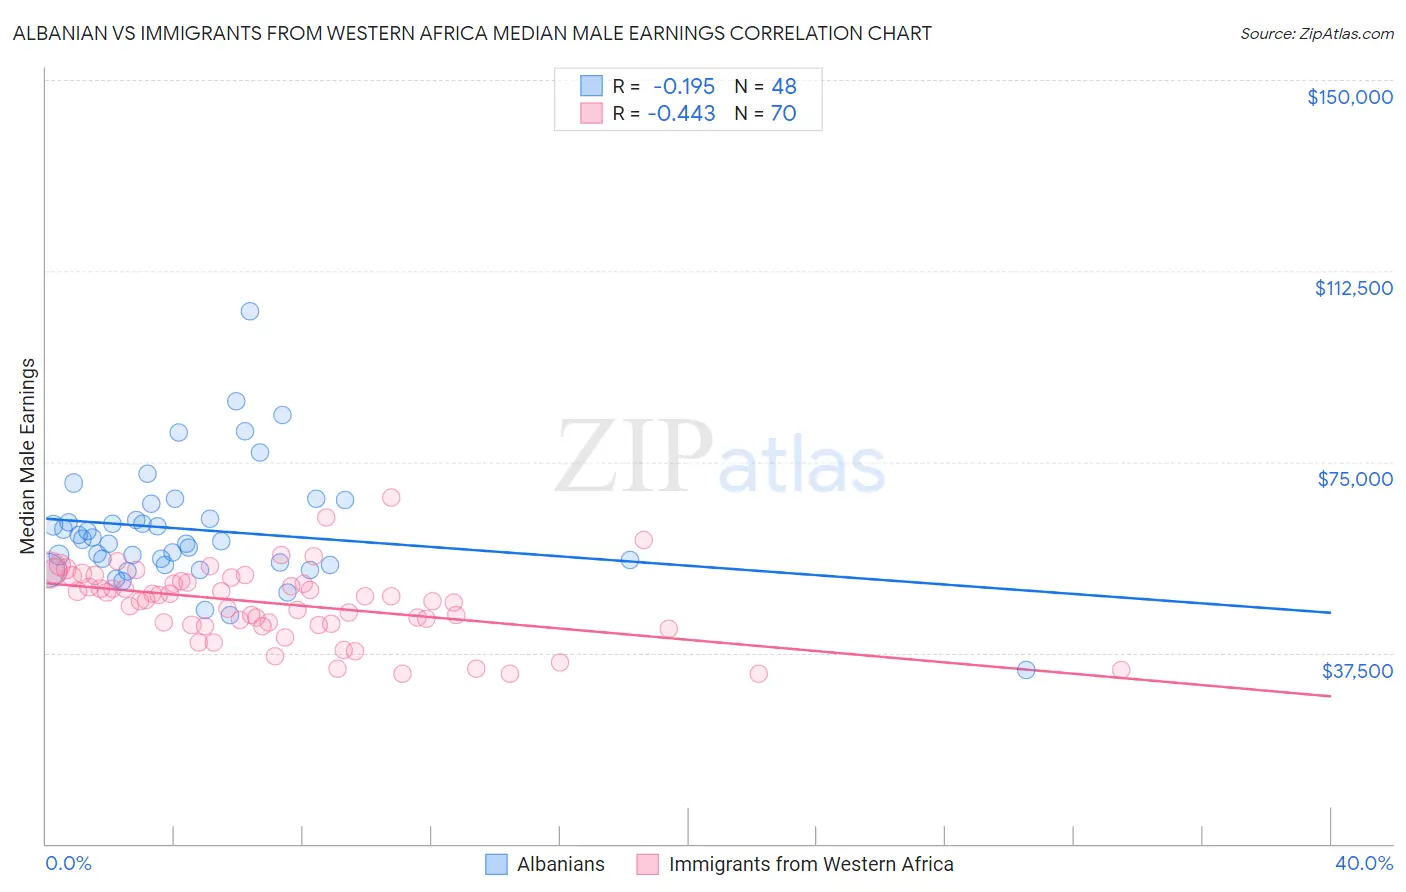
Albanian vs Immigrants from Western Africa Median Male Earnings Correlation Chart
The statistical analysis conducted on geographies consisting of 193,234,421 people shows a poor negative correlation between the proportion of Albanians and median male earnings in the United States with a correlation coefficient (R) of -0.195 and weighted average of $58,680. Similarly, the statistical analysis conducted on geographies consisting of 357,835,205 people shows a moderate negative correlation between the proportion of Immigrants from Western Africa and median male earnings in the United States with a correlation coefficient (R) of -0.443 and weighted average of $50,940, a difference of 15.2%.
Median Male Earnings Correlation Summary
| Measurement | Albanian | Immigrants from Western Africa |
| Minimum | $34,079 | $33,371 |
| Maximum | $104,479 | $67,960 |
| Range | $70,400 | $34,589 |
| Mean | $61,666 | $47,183 |
| Median | $59,610 | $48,227 |
| Interquartile 25% (IQ1) | $54,972 | $42,968 |
| Interquartile 75% (IQ3) | $65,262 | $51,502 |
| Interquartile Range (IQR) | $10,290 | $8,534 |
| Standard Deviation (Sample) | $11,807 | $7,172 |
| Standard Deviation (Population) | $11,684 | $7,120 |
Similar Demographics by Median Male Earnings
Demographics Similar to Albanians by Median Male Earnings
In terms of median male earnings, the demographic groups most similar to Albanians are Northern European ($58,588, a difference of 0.16%), Immigrants from Lebanon ($58,835, a difference of 0.27%), Jordanian ($58,500, a difference of 0.31%), Immigrants from Poland ($58,452, a difference of 0.39%), and Assyrian/Chaldean/Syriac ($58,437, a difference of 0.42%).
| Demographics | Rating | Rank | Median Male Earnings |
| Immigrants | Moldova | 99.2 /100 | #89 | Exceptional $59,417 |
| Austrians | 99.2 /100 | #90 | Exceptional $59,359 |
| Laotians | 99.2 /100 | #91 | Exceptional $59,351 |
| Immigrants | Kazakhstan | 99.1 /100 | #92 | Exceptional $59,278 |
| Immigrants | Southern Europe | 99.0 /100 | #93 | Exceptional $59,217 |
| Immigrants | North Macedonia | 99.0 /100 | #94 | Exceptional $59,189 |
| Immigrants | Lebanon | 98.6 /100 | #95 | Exceptional $58,835 |
| Albanians | 98.4 /100 | #96 | Exceptional $58,680 |
| Northern Europeans | 98.2 /100 | #97 | Exceptional $58,588 |
| Jordanians | 98.1 /100 | #98 | Exceptional $58,500 |
| Immigrants | Poland | 98.0 /100 | #99 | Exceptional $58,452 |
| Assyrians/Chaldeans/Syriacs | 97.9 /100 | #100 | Exceptional $58,437 |
| Immigrants | Brazil | 97.7 /100 | #101 | Exceptional $58,324 |
| Syrians | 97.4 /100 | #102 | Exceptional $58,187 |
| Poles | 97.3 /100 | #103 | Exceptional $58,139 |
Demographics Similar to Immigrants from Western Africa by Median Male Earnings
In terms of median male earnings, the demographic groups most similar to Immigrants from Western Africa are Pennsylvania German ($50,878, a difference of 0.12%), Immigrants from Barbados ($50,795, a difference of 0.28%), Cape Verdean ($51,103, a difference of 0.32%), Malaysian ($50,772, a difference of 0.33%), and American ($50,761, a difference of 0.35%).
| Demographics | Rating | Rank | Median Male Earnings |
| Samoans | 4.6 /100 | #228 | Tragic $51,389 |
| Immigrants | Trinidad and Tobago | 4.5 /100 | #229 | Tragic $51,376 |
| Immigrants | Nigeria | 4.2 /100 | #230 | Tragic $51,310 |
| Barbadians | 3.9 /100 | #231 | Tragic $51,236 |
| Sudanese | 3.9 /100 | #232 | Tragic $51,216 |
| Aleuts | 3.7 /100 | #233 | Tragic $51,168 |
| Cape Verdeans | 3.5 /100 | #234 | Tragic $51,103 |
| Immigrants | Western Africa | 3.0 /100 | #235 | Tragic $50,940 |
| Pennsylvania Germans | 2.8 /100 | #236 | Tragic $50,878 |
| Immigrants | Barbados | 2.6 /100 | #237 | Tragic $50,795 |
| Malaysians | 2.5 /100 | #238 | Tragic $50,772 |
| Americans | 2.5 /100 | #239 | Tragic $50,761 |
| West Indians | 2.3 /100 | #240 | Tragic $50,682 |
| Immigrants | St. Vincent and the Grenadines | 2.3 /100 | #241 | Tragic $50,665 |
| Guyanese | 2.2 /100 | #242 | Tragic $50,613 |