Albanian vs Immigrants from Belgium Median Male Earnings
COMPARE
Albanian
Immigrants from Belgium
Median Male Earnings
Median Male Earnings Comparison
Albanians
Immigrants from Belgium
$58,680
MEDIAN MALE EARNINGS
98.4/ 100
METRIC RATING
96th/ 347
METRIC RANK
$66,125
MEDIAN MALE EARNINGS
100.0/ 100
METRIC RATING
17th/ 347
METRIC RANK
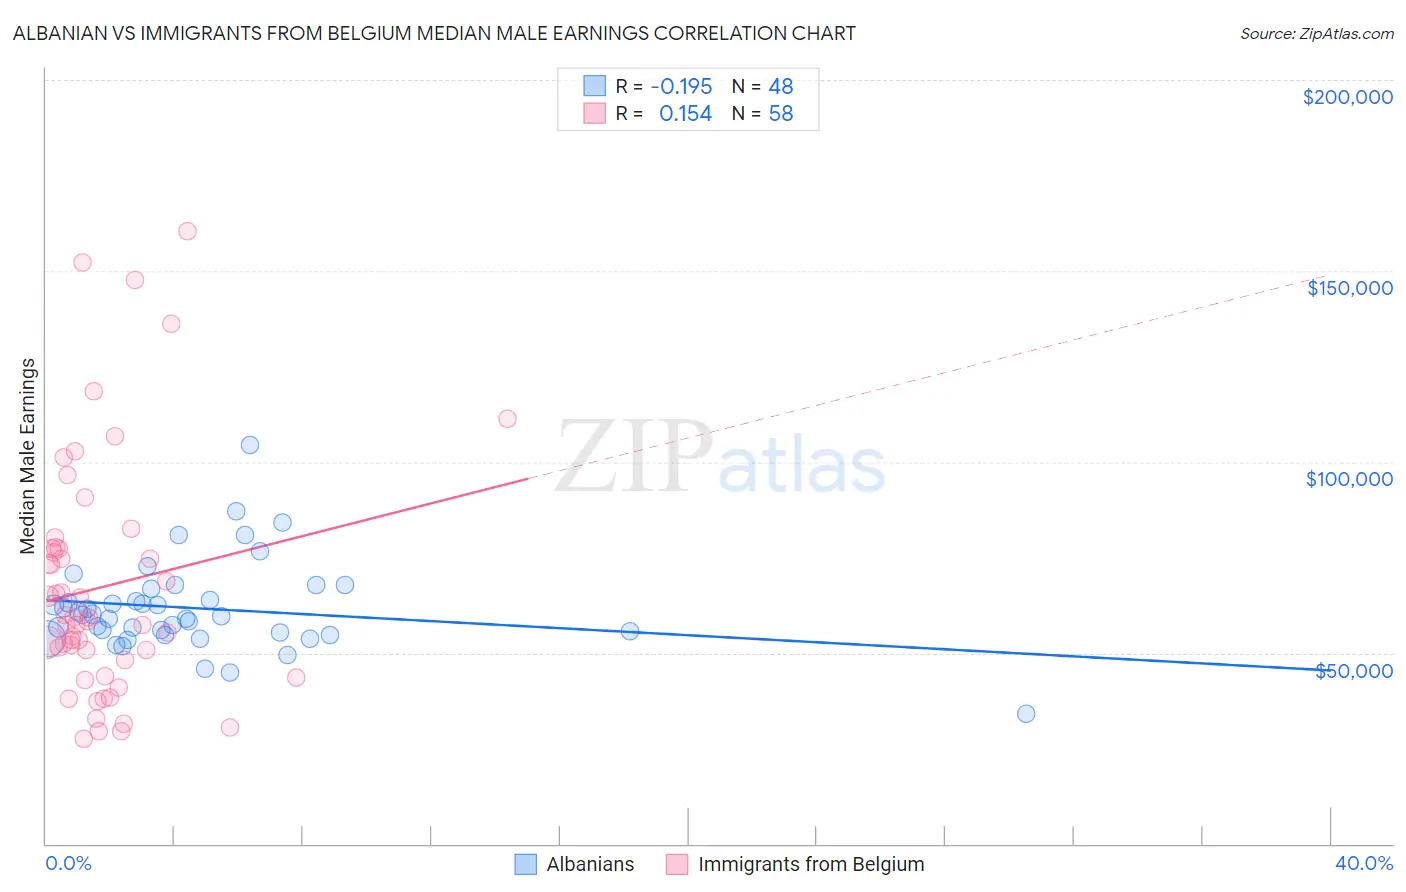
Albanian vs Immigrants from Belgium Median Male Earnings Correlation Chart
The statistical analysis conducted on geographies consisting of 193,234,421 people shows a poor negative correlation between the proportion of Albanians and median male earnings in the United States with a correlation coefficient (R) of -0.195 and weighted average of $58,680. Similarly, the statistical analysis conducted on geographies consisting of 146,683,317 people shows a poor positive correlation between the proportion of Immigrants from Belgium and median male earnings in the United States with a correlation coefficient (R) of 0.154 and weighted average of $66,125, a difference of 12.7%.
Median Male Earnings Correlation Summary
| Measurement | Albanian | Immigrants from Belgium |
| Minimum | $34,079 | $27,540 |
| Maximum | $104,479 | $160,536 |
| Range | $70,400 | $132,996 |
| Mean | $61,666 | $67,352 |
| Median | $59,610 | $58,812 |
| Interquartile 25% (IQ1) | $54,972 | $48,036 |
| Interquartile 75% (IQ3) | $65,262 | $77,202 |
| Interquartile Range (IQR) | $10,290 | $29,166 |
| Standard Deviation (Sample) | $11,807 | $31,129 |
| Standard Deviation (Population) | $11,684 | $30,859 |
Similar Demographics by Median Male Earnings
Demographics Similar to Albanians by Median Male Earnings
In terms of median male earnings, the demographic groups most similar to Albanians are Northern European ($58,588, a difference of 0.16%), Immigrants from Lebanon ($58,835, a difference of 0.27%), Jordanian ($58,500, a difference of 0.31%), Immigrants from Poland ($58,452, a difference of 0.39%), and Assyrian/Chaldean/Syriac ($58,437, a difference of 0.42%).
| Demographics | Rating | Rank | Median Male Earnings |
| Immigrants | Moldova | 99.2 /100 | #89 | Exceptional $59,417 |
| Austrians | 99.2 /100 | #90 | Exceptional $59,359 |
| Laotians | 99.2 /100 | #91 | Exceptional $59,351 |
| Immigrants | Kazakhstan | 99.1 /100 | #92 | Exceptional $59,278 |
| Immigrants | Southern Europe | 99.0 /100 | #93 | Exceptional $59,217 |
| Immigrants | North Macedonia | 99.0 /100 | #94 | Exceptional $59,189 |
| Immigrants | Lebanon | 98.6 /100 | #95 | Exceptional $58,835 |
| Albanians | 98.4 /100 | #96 | Exceptional $58,680 |
| Northern Europeans | 98.2 /100 | #97 | Exceptional $58,588 |
| Jordanians | 98.1 /100 | #98 | Exceptional $58,500 |
| Immigrants | Poland | 98.0 /100 | #99 | Exceptional $58,452 |
| Assyrians/Chaldeans/Syriacs | 97.9 /100 | #100 | Exceptional $58,437 |
| Immigrants | Brazil | 97.7 /100 | #101 | Exceptional $58,324 |
| Syrians | 97.4 /100 | #102 | Exceptional $58,187 |
| Poles | 97.3 /100 | #103 | Exceptional $58,139 |
Demographics Similar to Immigrants from Belgium by Median Male Earnings
In terms of median male earnings, the demographic groups most similar to Immigrants from Belgium are Indian (Asian) ($66,078, a difference of 0.070%), Eastern European ($66,472, a difference of 0.53%), Cypriot ($65,549, a difference of 0.88%), Immigrants from Japan ($65,518, a difference of 0.93%), and Immigrants from Sweden ($65,406, a difference of 1.1%).
| Demographics | Rating | Rank | Median Male Earnings |
| Immigrants | Israel | 100.0 /100 | #10 | Exceptional $68,716 |
| Immigrants | Ireland | 100.0 /100 | #11 | Exceptional $67,698 |
| Immigrants | Australia | 100.0 /100 | #12 | Exceptional $67,634 |
| Immigrants | China | 100.0 /100 | #13 | Exceptional $67,353 |
| Okinawans | 100.0 /100 | #14 | Exceptional $67,232 |
| Immigrants | Eastern Asia | 100.0 /100 | #15 | Exceptional $66,903 |
| Eastern Europeans | 100.0 /100 | #16 | Exceptional $66,472 |
| Immigrants | Belgium | 100.0 /100 | #17 | Exceptional $66,125 |
| Indians (Asian) | 100.0 /100 | #18 | Exceptional $66,078 |
| Cypriots | 100.0 /100 | #19 | Exceptional $65,549 |
| Immigrants | Japan | 100.0 /100 | #20 | Exceptional $65,518 |
| Immigrants | Sweden | 100.0 /100 | #21 | Exceptional $65,406 |
| Burmese | 100.0 /100 | #22 | Exceptional $65,236 |
| Immigrants | Korea | 100.0 /100 | #23 | Exceptional $65,079 |
| Immigrants | Northern Europe | 100.0 /100 | #24 | Exceptional $64,987 |