Albanian vs Blackfeet Median Male Earnings
COMPARE
Albanian
Blackfeet
Median Male Earnings
Median Male Earnings Comparison
Albanians
Blackfeet
$58,680
MEDIAN MALE EARNINGS
98.4/ 100
METRIC RATING
96th/ 347
METRIC RANK
$48,402
MEDIAN MALE EARNINGS
0.3/ 100
METRIC RATING
276th/ 347
METRIC RANK
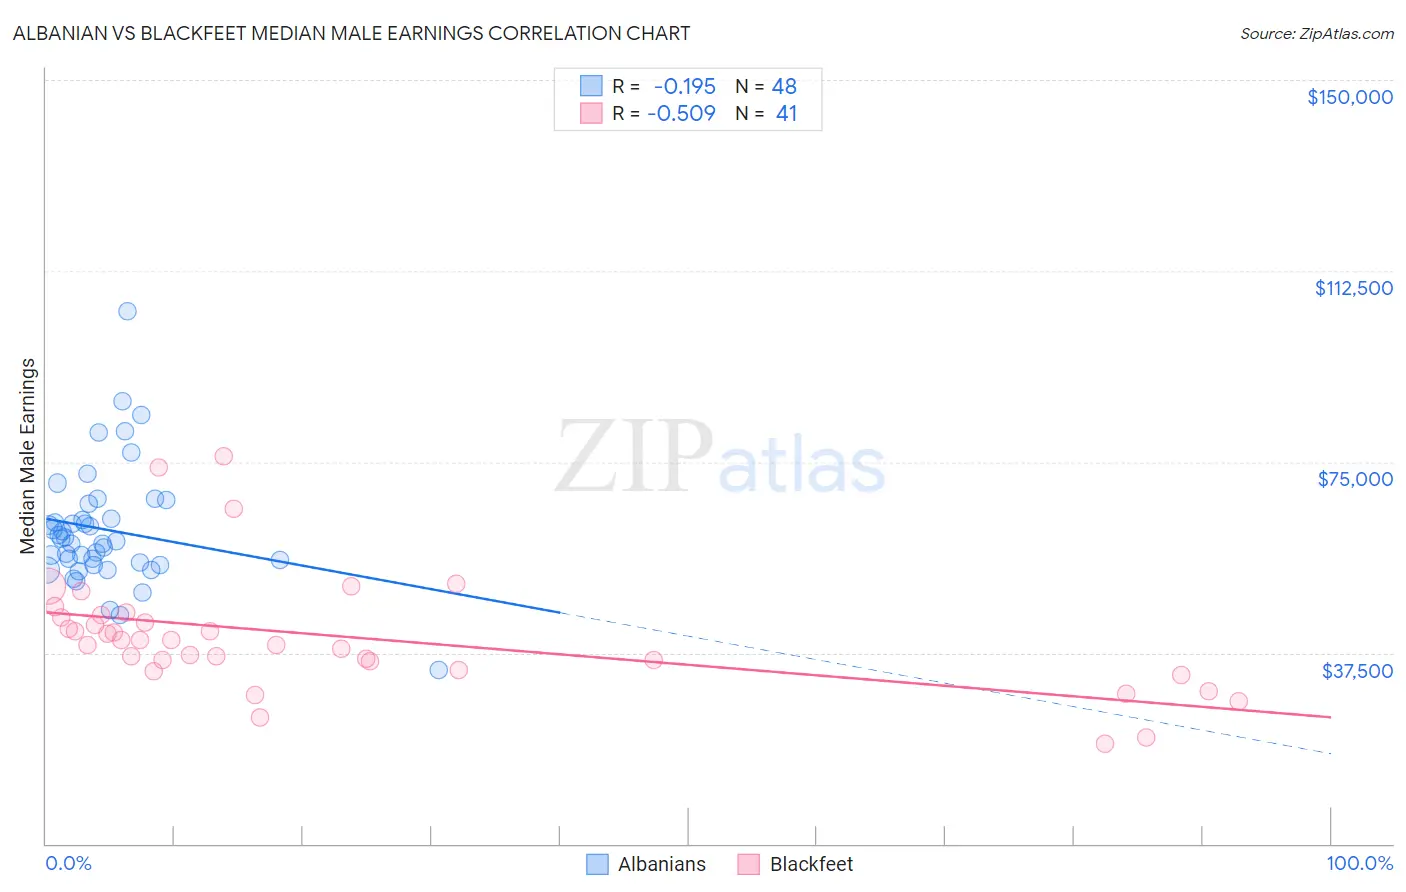
Albanian vs Blackfeet Median Male Earnings Correlation Chart
The statistical analysis conducted on geographies consisting of 193,234,421 people shows a poor negative correlation between the proportion of Albanians and median male earnings in the United States with a correlation coefficient (R) of -0.195 and weighted average of $58,680. Similarly, the statistical analysis conducted on geographies consisting of 309,464,268 people shows a substantial negative correlation between the proportion of Blackfeet and median male earnings in the United States with a correlation coefficient (R) of -0.509 and weighted average of $48,402, a difference of 21.2%.
Median Male Earnings Correlation Summary
| Measurement | Albanian | Blackfeet |
| Minimum | $34,079 | $19,559 |
| Maximum | $104,479 | $76,032 |
| Range | $70,400 | $56,473 |
| Mean | $61,666 | $40,687 |
| Median | $59,610 | $39,915 |
| Interquartile 25% (IQ1) | $54,972 | $35,022 |
| Interquartile 75% (IQ3) | $65,262 | $44,674 |
| Interquartile Range (IQR) | $10,290 | $9,652 |
| Standard Deviation (Sample) | $11,807 | $11,608 |
| Standard Deviation (Population) | $11,684 | $11,465 |
Similar Demographics by Median Male Earnings
Demographics Similar to Albanians by Median Male Earnings
In terms of median male earnings, the demographic groups most similar to Albanians are Northern European ($58,588, a difference of 0.16%), Immigrants from Lebanon ($58,835, a difference of 0.27%), Jordanian ($58,500, a difference of 0.31%), Immigrants from Poland ($58,452, a difference of 0.39%), and Assyrian/Chaldean/Syriac ($58,437, a difference of 0.42%).
| Demographics | Rating | Rank | Median Male Earnings |
| Immigrants | Moldova | 99.2 /100 | #89 | Exceptional $59,417 |
| Austrians | 99.2 /100 | #90 | Exceptional $59,359 |
| Laotians | 99.2 /100 | #91 | Exceptional $59,351 |
| Immigrants | Kazakhstan | 99.1 /100 | #92 | Exceptional $59,278 |
| Immigrants | Southern Europe | 99.0 /100 | #93 | Exceptional $59,217 |
| Immigrants | North Macedonia | 99.0 /100 | #94 | Exceptional $59,189 |
| Immigrants | Lebanon | 98.6 /100 | #95 | Exceptional $58,835 |
| Albanians | 98.4 /100 | #96 | Exceptional $58,680 |
| Northern Europeans | 98.2 /100 | #97 | Exceptional $58,588 |
| Jordanians | 98.1 /100 | #98 | Exceptional $58,500 |
| Immigrants | Poland | 98.0 /100 | #99 | Exceptional $58,452 |
| Assyrians/Chaldeans/Syriacs | 97.9 /100 | #100 | Exceptional $58,437 |
| Immigrants | Brazil | 97.7 /100 | #101 | Exceptional $58,324 |
| Syrians | 97.4 /100 | #102 | Exceptional $58,187 |
| Poles | 97.3 /100 | #103 | Exceptional $58,139 |
Demographics Similar to Blackfeet by Median Male Earnings
In terms of median male earnings, the demographic groups most similar to Blackfeet are Immigrants from Somalia ($48,439, a difference of 0.080%), Belizean ($48,358, a difference of 0.090%), Immigrants from Liberia ($48,317, a difference of 0.18%), Colville ($48,516, a difference of 0.24%), and Hmong ($48,254, a difference of 0.31%).
| Demographics | Rating | Rank | Median Male Earnings |
| Tsimshian | 0.4 /100 | #269 | Tragic $48,836 |
| Potawatomi | 0.4 /100 | #270 | Tragic $48,768 |
| Cherokee | 0.3 /100 | #271 | Tragic $48,669 |
| Salvadorans | 0.3 /100 | #272 | Tragic $48,646 |
| Jamaicans | 0.3 /100 | #273 | Tragic $48,632 |
| Colville | 0.3 /100 | #274 | Tragic $48,516 |
| Immigrants | Somalia | 0.3 /100 | #275 | Tragic $48,439 |
| Blackfeet | 0.3 /100 | #276 | Tragic $48,402 |
| Belizeans | 0.2 /100 | #277 | Tragic $48,358 |
| Immigrants | Liberia | 0.2 /100 | #278 | Tragic $48,317 |
| Hmong | 0.2 /100 | #279 | Tragic $48,254 |
| Comanche | 0.2 /100 | #280 | Tragic $48,202 |
| Marshallese | 0.2 /100 | #281 | Tragic $48,137 |
| Central Americans | 0.2 /100 | #282 | Tragic $48,093 |
| Immigrants | Jamaica | 0.2 /100 | #283 | Tragic $48,040 |