Albanian vs Alaska Native Median Male Earnings
COMPARE
Albanian
Alaska Native
Median Male Earnings
Median Male Earnings Comparison
Albanians
Alaska Natives
$58,680
MEDIAN MALE EARNINGS
98.4/ 100
METRIC RATING
96th/ 347
METRIC RANK
$49,711
MEDIAN MALE EARNINGS
0.9/ 100
METRIC RATING
256th/ 347
METRIC RANK
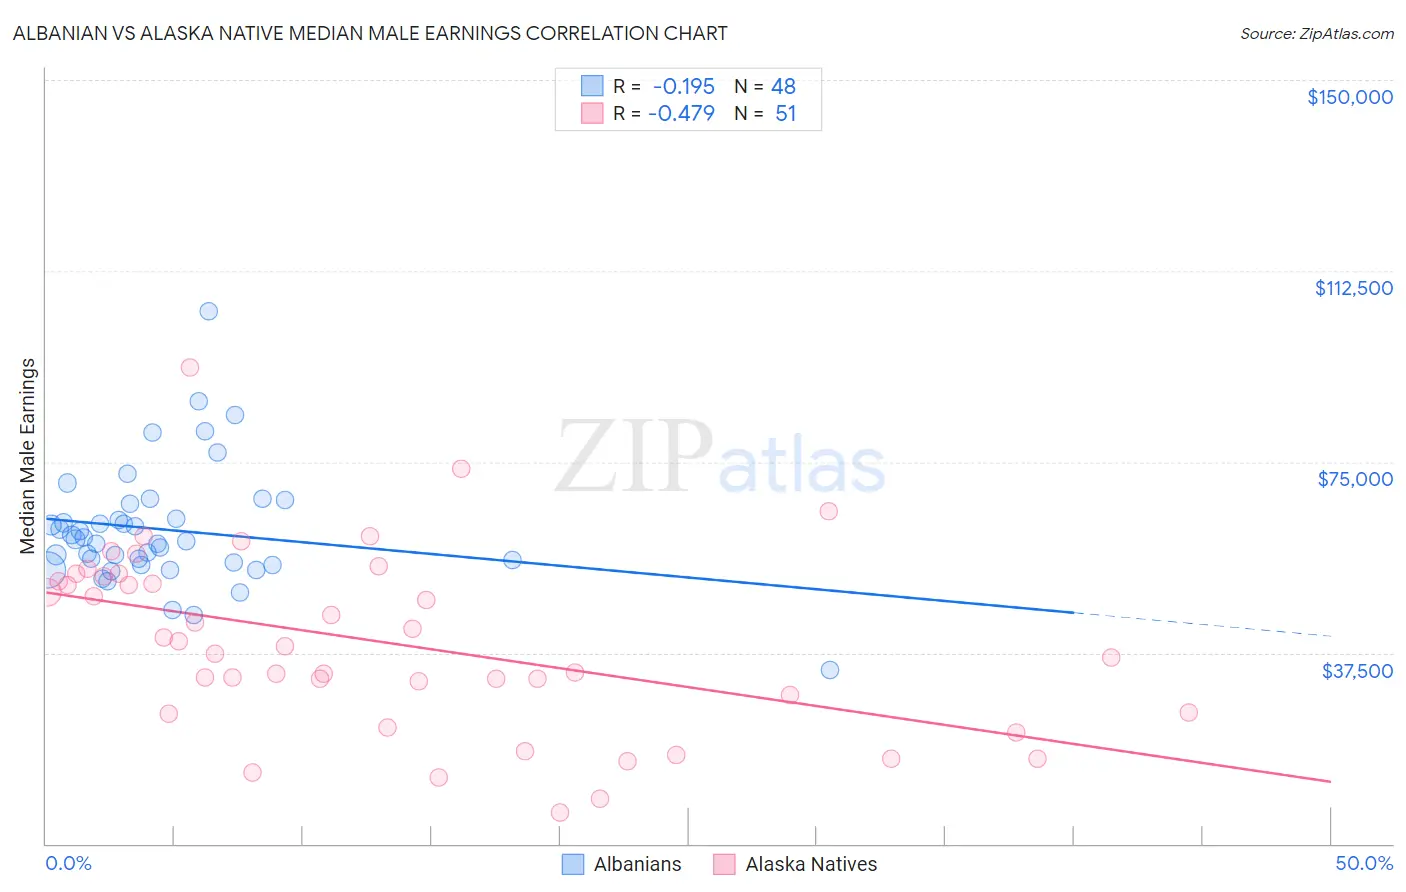
Albanian vs Alaska Native Median Male Earnings Correlation Chart
The statistical analysis conducted on geographies consisting of 193,234,421 people shows a poor negative correlation between the proportion of Albanians and median male earnings in the United States with a correlation coefficient (R) of -0.195 and weighted average of $58,680. Similarly, the statistical analysis conducted on geographies consisting of 76,751,910 people shows a moderate negative correlation between the proportion of Alaska Natives and median male earnings in the United States with a correlation coefficient (R) of -0.479 and weighted average of $49,711, a difference of 18.0%.
Median Male Earnings Correlation Summary
| Measurement | Albanian | Alaska Native |
| Minimum | $34,079 | $6,250 |
| Maximum | $104,479 | $93,451 |
| Range | $70,400 | $87,201 |
| Mean | $61,666 | $39,521 |
| Median | $59,610 | $38,750 |
| Interquartile 25% (IQ1) | $54,972 | $25,833 |
| Interquartile 75% (IQ3) | $65,262 | $52,440 |
| Interquartile Range (IQR) | $10,290 | $26,607 |
| Standard Deviation (Sample) | $11,807 | $17,827 |
| Standard Deviation (Population) | $11,684 | $17,652 |
Similar Demographics by Median Male Earnings
Demographics Similar to Albanians by Median Male Earnings
In terms of median male earnings, the demographic groups most similar to Albanians are Northern European ($58,588, a difference of 0.16%), Immigrants from Lebanon ($58,835, a difference of 0.27%), Jordanian ($58,500, a difference of 0.31%), Immigrants from Poland ($58,452, a difference of 0.39%), and Assyrian/Chaldean/Syriac ($58,437, a difference of 0.42%).
| Demographics | Rating | Rank | Median Male Earnings |
| Immigrants | Moldova | 99.2 /100 | #89 | Exceptional $59,417 |
| Austrians | 99.2 /100 | #90 | Exceptional $59,359 |
| Laotians | 99.2 /100 | #91 | Exceptional $59,351 |
| Immigrants | Kazakhstan | 99.1 /100 | #92 | Exceptional $59,278 |
| Immigrants | Southern Europe | 99.0 /100 | #93 | Exceptional $59,217 |
| Immigrants | North Macedonia | 99.0 /100 | #94 | Exceptional $59,189 |
| Immigrants | Lebanon | 98.6 /100 | #95 | Exceptional $58,835 |
| Albanians | 98.4 /100 | #96 | Exceptional $58,680 |
| Northern Europeans | 98.2 /100 | #97 | Exceptional $58,588 |
| Jordanians | 98.1 /100 | #98 | Exceptional $58,500 |
| Immigrants | Poland | 98.0 /100 | #99 | Exceptional $58,452 |
| Assyrians/Chaldeans/Syriacs | 97.9 /100 | #100 | Exceptional $58,437 |
| Immigrants | Brazil | 97.7 /100 | #101 | Exceptional $58,324 |
| Syrians | 97.4 /100 | #102 | Exceptional $58,187 |
| Poles | 97.3 /100 | #103 | Exceptional $58,139 |
Demographics Similar to Alaska Natives by Median Male Earnings
In terms of median male earnings, the demographic groups most similar to Alaska Natives are Alaskan Athabascan ($49,748, a difference of 0.070%), Senegalese ($49,774, a difference of 0.13%), British West Indian ($49,636, a difference of 0.15%), German Russian ($49,924, a difference of 0.43%), and Cree ($49,497, a difference of 0.43%).
| Demographics | Rating | Rank | Median Male Earnings |
| Immigrants | Burma/Myanmar | 1.6 /100 | #249 | Tragic $50,298 |
| Osage | 1.6 /100 | #250 | Tragic $50,292 |
| Immigrants | Grenada | 1.6 /100 | #251 | Tragic $50,279 |
| Immigrants | Cabo Verde | 1.2 /100 | #252 | Tragic $50,009 |
| German Russians | 1.1 /100 | #253 | Tragic $49,924 |
| Senegalese | 1.0 /100 | #254 | Tragic $49,774 |
| Alaskan Athabascans | 0.9 /100 | #255 | Tragic $49,748 |
| Alaska Natives | 0.9 /100 | #256 | Tragic $49,711 |
| British West Indians | 0.8 /100 | #257 | Tragic $49,636 |
| Cree | 0.7 /100 | #258 | Tragic $49,497 |
| Nepalese | 0.7 /100 | #259 | Tragic $49,458 |
| Iroquois | 0.7 /100 | #260 | Tragic $49,374 |
| Liberians | 0.6 /100 | #261 | Tragic $49,318 |
| Immigrants | West Indies | 0.6 /100 | #262 | Tragic $49,271 |
| Nicaraguans | 0.6 /100 | #263 | Tragic $49,215 |