Albanian vs Immigrants from France Median Male Earnings
COMPARE
Albanian
Immigrants from France
Median Male Earnings
Median Male Earnings Comparison
Albanians
Immigrants from France
$58,680
MEDIAN MALE EARNINGS
98.4/ 100
METRIC RATING
96th/ 347
METRIC RANK
$63,715
MEDIAN MALE EARNINGS
100.0/ 100
METRIC RATING
30th/ 347
METRIC RANK
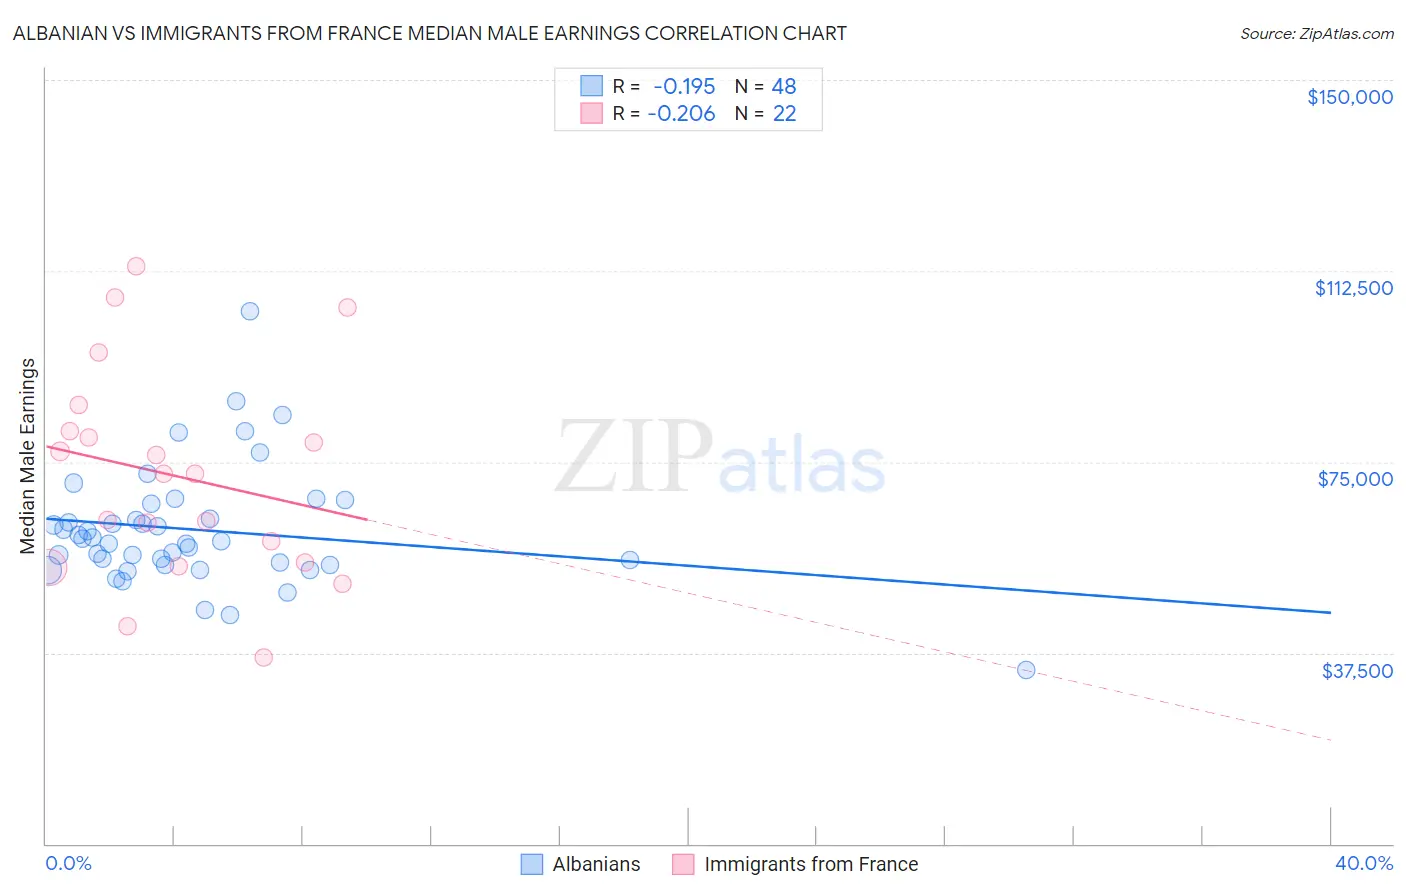
Albanian vs Immigrants from France Median Male Earnings Correlation Chart
The statistical analysis conducted on geographies consisting of 193,234,421 people shows a poor negative correlation between the proportion of Albanians and median male earnings in the United States with a correlation coefficient (R) of -0.195 and weighted average of $58,680. Similarly, the statistical analysis conducted on geographies consisting of 287,844,357 people shows a weak negative correlation between the proportion of Immigrants from France and median male earnings in the United States with a correlation coefficient (R) of -0.206 and weighted average of $63,715, a difference of 8.6%.
Median Male Earnings Correlation Summary
| Measurement | Albanian | Immigrants from France |
| Minimum | $34,079 | $36,667 |
| Maximum | $104,479 | $113,322 |
| Range | $70,400 | $76,655 |
| Mean | $61,666 | $72,320 |
| Median | $59,610 | $72,692 |
| Interquartile 25% (IQ1) | $54,972 | $55,273 |
| Interquartile 75% (IQ3) | $65,262 | $81,126 |
| Interquartile Range (IQR) | $10,290 | $25,853 |
| Standard Deviation (Sample) | $11,807 | $20,619 |
| Standard Deviation (Population) | $11,684 | $20,145 |
Similar Demographics by Median Male Earnings
Demographics Similar to Albanians by Median Male Earnings
In terms of median male earnings, the demographic groups most similar to Albanians are Northern European ($58,588, a difference of 0.16%), Immigrants from Lebanon ($58,835, a difference of 0.27%), Jordanian ($58,500, a difference of 0.31%), Immigrants from Poland ($58,452, a difference of 0.39%), and Assyrian/Chaldean/Syriac ($58,437, a difference of 0.42%).
| Demographics | Rating | Rank | Median Male Earnings |
| Immigrants | Moldova | 99.2 /100 | #89 | Exceptional $59,417 |
| Austrians | 99.2 /100 | #90 | Exceptional $59,359 |
| Laotians | 99.2 /100 | #91 | Exceptional $59,351 |
| Immigrants | Kazakhstan | 99.1 /100 | #92 | Exceptional $59,278 |
| Immigrants | Southern Europe | 99.0 /100 | #93 | Exceptional $59,217 |
| Immigrants | North Macedonia | 99.0 /100 | #94 | Exceptional $59,189 |
| Immigrants | Lebanon | 98.6 /100 | #95 | Exceptional $58,835 |
| Albanians | 98.4 /100 | #96 | Exceptional $58,680 |
| Northern Europeans | 98.2 /100 | #97 | Exceptional $58,588 |
| Jordanians | 98.1 /100 | #98 | Exceptional $58,500 |
| Immigrants | Poland | 98.0 /100 | #99 | Exceptional $58,452 |
| Assyrians/Chaldeans/Syriacs | 97.9 /100 | #100 | Exceptional $58,437 |
| Immigrants | Brazil | 97.7 /100 | #101 | Exceptional $58,324 |
| Syrians | 97.4 /100 | #102 | Exceptional $58,187 |
| Poles | 97.3 /100 | #103 | Exceptional $58,139 |
Demographics Similar to Immigrants from France by Median Male Earnings
In terms of median male earnings, the demographic groups most similar to Immigrants from France are Asian ($63,827, a difference of 0.18%), Latvian ($63,498, a difference of 0.34%), Russian ($63,939, a difference of 0.35%), Immigrants from Switzerland ($63,944, a difference of 0.36%), and Soviet Union ($63,382, a difference of 0.53%).
| Demographics | Rating | Rank | Median Male Earnings |
| Immigrants | Korea | 100.0 /100 | #23 | Exceptional $65,079 |
| Immigrants | Northern Europe | 100.0 /100 | #24 | Exceptional $64,987 |
| Immigrants | Denmark | 100.0 /100 | #25 | Exceptional $64,625 |
| Turks | 100.0 /100 | #26 | Exceptional $64,253 |
| Immigrants | Switzerland | 100.0 /100 | #27 | Exceptional $63,944 |
| Russians | 100.0 /100 | #28 | Exceptional $63,939 |
| Asians | 100.0 /100 | #29 | Exceptional $63,827 |
| Immigrants | France | 100.0 /100 | #30 | Exceptional $63,715 |
| Latvians | 100.0 /100 | #31 | Exceptional $63,498 |
| Soviet Union | 100.0 /100 | #32 | Exceptional $63,382 |
| Immigrants | Lithuania | 100.0 /100 | #33 | Exceptional $63,346 |
| Immigrants | Russia | 100.0 /100 | #34 | Exceptional $63,326 |
| Immigrants | Asia | 100.0 /100 | #35 | Exceptional $63,240 |
| Israelis | 100.0 /100 | #36 | Exceptional $63,228 |
| Immigrants | Sri Lanka | 100.0 /100 | #37 | Exceptional $63,099 |