Albanian vs Immigrants from Ecuador Median Male Earnings
COMPARE
Albanian
Immigrants from Ecuador
Median Male Earnings
Median Male Earnings Comparison
Albanians
Immigrants from Ecuador
$58,680
MEDIAN MALE EARNINGS
98.4/ 100
METRIC RATING
96th/ 347
METRIC RANK
$50,474
MEDIAN MALE EARNINGS
1.9/ 100
METRIC RATING
246th/ 347
METRIC RANK
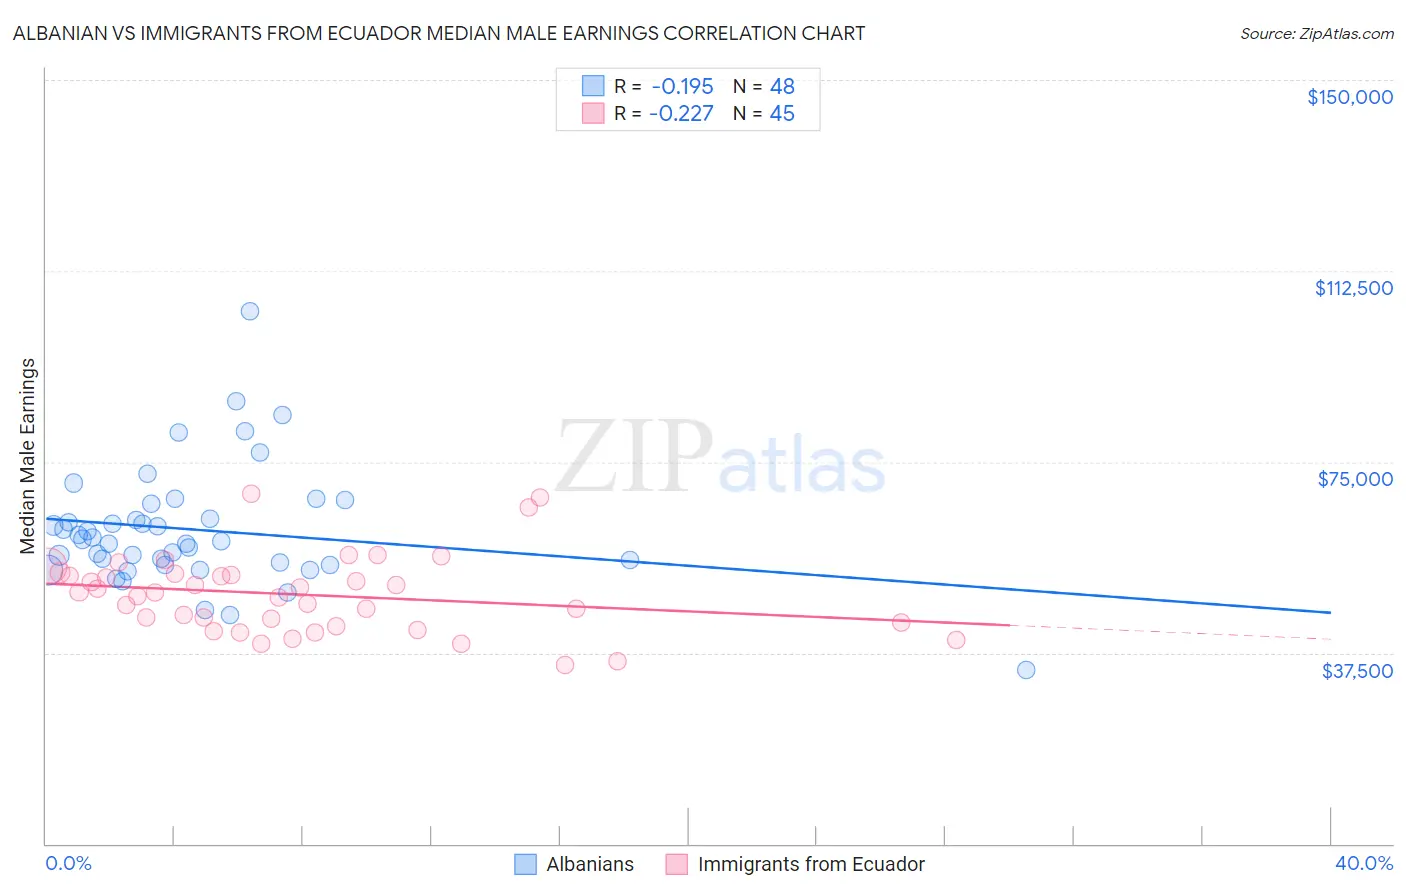
Albanian vs Immigrants from Ecuador Median Male Earnings Correlation Chart
The statistical analysis conducted on geographies consisting of 193,234,421 people shows a poor negative correlation between the proportion of Albanians and median male earnings in the United States with a correlation coefficient (R) of -0.195 and weighted average of $58,680. Similarly, the statistical analysis conducted on geographies consisting of 270,963,841 people shows a weak negative correlation between the proportion of Immigrants from Ecuador and median male earnings in the United States with a correlation coefficient (R) of -0.227 and weighted average of $50,474, a difference of 16.3%.
Median Male Earnings Correlation Summary
| Measurement | Albanian | Immigrants from Ecuador |
| Minimum | $34,079 | $35,014 |
| Maximum | $104,479 | $68,684 |
| Range | $70,400 | $33,670 |
| Mean | $61,666 | $48,933 |
| Median | $59,610 | $49,320 |
| Interquartile 25% (IQ1) | $54,972 | $42,981 |
| Interquartile 75% (IQ3) | $65,262 | $52,866 |
| Interquartile Range (IQR) | $10,290 | $9,884 |
| Standard Deviation (Sample) | $11,807 | $7,606 |
| Standard Deviation (Population) | $11,684 | $7,521 |
Similar Demographics by Median Male Earnings
Demographics Similar to Albanians by Median Male Earnings
In terms of median male earnings, the demographic groups most similar to Albanians are Northern European ($58,588, a difference of 0.16%), Immigrants from Lebanon ($58,835, a difference of 0.27%), Jordanian ($58,500, a difference of 0.31%), Immigrants from Poland ($58,452, a difference of 0.39%), and Assyrian/Chaldean/Syriac ($58,437, a difference of 0.42%).
| Demographics | Rating | Rank | Median Male Earnings |
| Immigrants | Moldova | 99.2 /100 | #89 | Exceptional $59,417 |
| Austrians | 99.2 /100 | #90 | Exceptional $59,359 |
| Laotians | 99.2 /100 | #91 | Exceptional $59,351 |
| Immigrants | Kazakhstan | 99.1 /100 | #92 | Exceptional $59,278 |
| Immigrants | Southern Europe | 99.0 /100 | #93 | Exceptional $59,217 |
| Immigrants | North Macedonia | 99.0 /100 | #94 | Exceptional $59,189 |
| Immigrants | Lebanon | 98.6 /100 | #95 | Exceptional $58,835 |
| Albanians | 98.4 /100 | #96 | Exceptional $58,680 |
| Northern Europeans | 98.2 /100 | #97 | Exceptional $58,588 |
| Jordanians | 98.1 /100 | #98 | Exceptional $58,500 |
| Immigrants | Poland | 98.0 /100 | #99 | Exceptional $58,452 |
| Assyrians/Chaldeans/Syriacs | 97.9 /100 | #100 | Exceptional $58,437 |
| Immigrants | Brazil | 97.7 /100 | #101 | Exceptional $58,324 |
| Syrians | 97.4 /100 | #102 | Exceptional $58,187 |
| Poles | 97.3 /100 | #103 | Exceptional $58,139 |
Demographics Similar to Immigrants from Ecuador by Median Male Earnings
In terms of median male earnings, the demographic groups most similar to Immigrants from Ecuador are Hawaiian ($50,488, a difference of 0.030%), Subsaharan African ($50,408, a difference of 0.13%), Houma ($50,547, a difference of 0.14%), Guyanese ($50,613, a difference of 0.27%), and French American Indian ($50,611, a difference of 0.27%).
| Demographics | Rating | Rank | Median Male Earnings |
| Americans | 2.5 /100 | #239 | Tragic $50,761 |
| West Indians | 2.3 /100 | #240 | Tragic $50,682 |
| Immigrants | St. Vincent and the Grenadines | 2.3 /100 | #241 | Tragic $50,665 |
| Guyanese | 2.2 /100 | #242 | Tragic $50,613 |
| French American Indians | 2.2 /100 | #243 | Tragic $50,611 |
| Houma | 2.0 /100 | #244 | Tragic $50,547 |
| Hawaiians | 1.9 /100 | #245 | Tragic $50,488 |
| Immigrants | Ecuador | 1.9 /100 | #246 | Tragic $50,474 |
| Sub-Saharan Africans | 1.8 /100 | #247 | Tragic $50,408 |
| Immigrants | Guyana | 1.6 /100 | #248 | Tragic $50,321 |
| Immigrants | Burma/Myanmar | 1.6 /100 | #249 | Tragic $50,298 |
| Osage | 1.6 /100 | #250 | Tragic $50,292 |
| Immigrants | Grenada | 1.6 /100 | #251 | Tragic $50,279 |
| Immigrants | Cabo Verde | 1.2 /100 | #252 | Tragic $50,009 |
| German Russians | 1.1 /100 | #253 | Tragic $49,924 |