Immigrants from West Indies vs Immigrants from Uruguay Median Male Earnings
COMPARE
Immigrants from West Indies
Immigrants from Uruguay
Median Male Earnings
Median Male Earnings Comparison
Immigrants from West Indies
Immigrants from Uruguay
$49,271
MEDIAN MALE EARNINGS
0.6/ 100
METRIC RATING
262nd/ 347
METRIC RANK
$52,860
MEDIAN MALE EARNINGS
16.8/ 100
METRIC RATING
202nd/ 347
METRIC RANK
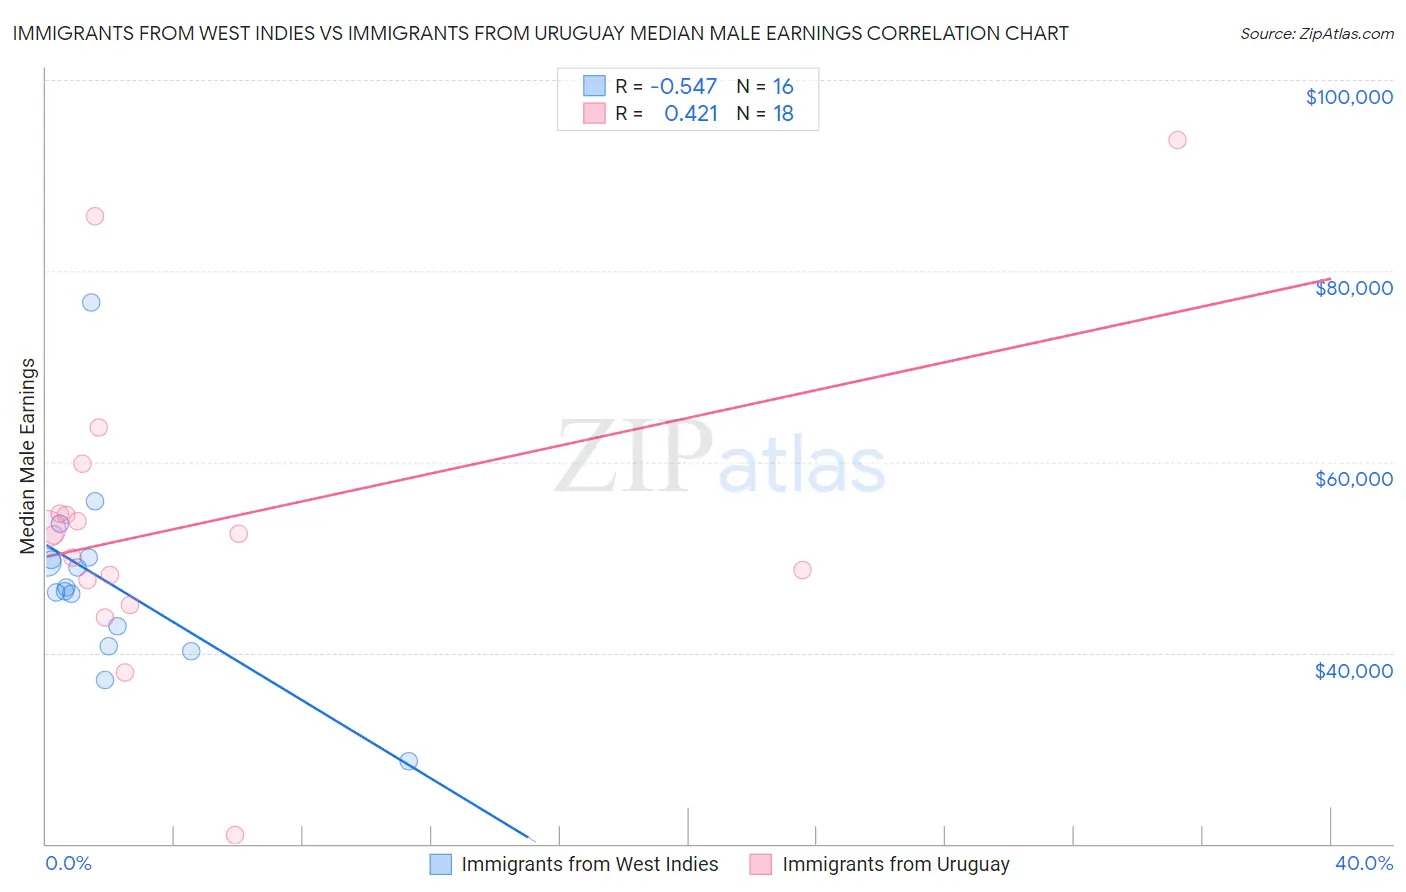
Immigrants from West Indies vs Immigrants from Uruguay Median Male Earnings Correlation Chart
The statistical analysis conducted on geographies consisting of 72,416,935 people shows a substantial negative correlation between the proportion of Immigrants from West Indies and median male earnings in the United States with a correlation coefficient (R) of -0.547 and weighted average of $49,271. Similarly, the statistical analysis conducted on geographies consisting of 133,249,563 people shows a moderate positive correlation between the proportion of Immigrants from Uruguay and median male earnings in the United States with a correlation coefficient (R) of 0.421 and weighted average of $52,860, a difference of 7.3%.
Median Male Earnings Correlation Summary
| Measurement | Immigrants from West Indies | Immigrants from Uruguay |
| Minimum | $28,702 | $20,946 |
| Maximum | $76,711 | $93,710 |
| Range | $48,009 | $72,764 |
| Mean | $47,473 | $53,632 |
| Median | $46,662 | $52,453 |
| Interquartile 25% (IQ1) | $41,722 | $47,598 |
| Interquartile 75% (IQ3) | $49,852 | $54,536 |
| Interquartile Range (IQR) | $8,130 | $6,938 |
| Standard Deviation (Sample) | $10,214 | $16,044 |
| Standard Deviation (Population) | $9,890 | $15,592 |
Similar Demographics by Median Male Earnings
Demographics Similar to Immigrants from West Indies by Median Male Earnings
In terms of median male earnings, the demographic groups most similar to Immigrants from West Indies are Liberian ($49,318, a difference of 0.10%), Nicaraguan ($49,215, a difference of 0.11%), Immigrants from Middle Africa ($49,201, a difference of 0.14%), Immigrants from Laos ($49,190, a difference of 0.16%), and Iroquois ($49,374, a difference of 0.21%).
| Demographics | Rating | Rank | Median Male Earnings |
| Alaskan Athabascans | 0.9 /100 | #255 | Tragic $49,748 |
| Alaska Natives | 0.9 /100 | #256 | Tragic $49,711 |
| British West Indians | 0.8 /100 | #257 | Tragic $49,636 |
| Cree | 0.7 /100 | #258 | Tragic $49,497 |
| Nepalese | 0.7 /100 | #259 | Tragic $49,458 |
| Iroquois | 0.7 /100 | #260 | Tragic $49,374 |
| Liberians | 0.6 /100 | #261 | Tragic $49,318 |
| Immigrants | West Indies | 0.6 /100 | #262 | Tragic $49,271 |
| Nicaraguans | 0.6 /100 | #263 | Tragic $49,215 |
| Immigrants | Middle Africa | 0.6 /100 | #264 | Tragic $49,201 |
| Immigrants | Laos | 0.6 /100 | #265 | Tragic $49,190 |
| Somalis | 0.5 /100 | #266 | Tragic $49,025 |
| Spanish Americans | 0.5 /100 | #267 | Tragic $49,008 |
| Ute | 0.4 /100 | #268 | Tragic $48,899 |
| Tsimshian | 0.4 /100 | #269 | Tragic $48,836 |
Demographics Similar to Immigrants from Uruguay by Median Male Earnings
In terms of median male earnings, the demographic groups most similar to Immigrants from Uruguay are Immigrants from Bosnia and Herzegovina ($52,869, a difference of 0.020%), Panamanian ($52,835, a difference of 0.050%), Immigrants from Thailand ($52,908, a difference of 0.090%), Ghanaian ($52,810, a difference of 0.10%), and Immigrants from Colombia ($52,725, a difference of 0.26%).
| Demographics | Rating | Rank | Median Male Earnings |
| Immigrants | Azores | 27.5 /100 | #195 | Fair $53,503 |
| Immigrants | Africa | 26.6 /100 | #196 | Fair $53,457 |
| Immigrants | Kenya | 26.0 /100 | #197 | Fair $53,427 |
| Immigrants | Costa Rica | 22.6 /100 | #198 | Fair $53,237 |
| Tongans | 22.3 /100 | #199 | Fair $53,218 |
| Immigrants | Thailand | 17.5 /100 | #200 | Poor $52,908 |
| Immigrants | Bosnia and Herzegovina | 16.9 /100 | #201 | Poor $52,869 |
| Immigrants | Uruguay | 16.8 /100 | #202 | Poor $52,860 |
| Panamanians | 16.5 /100 | #203 | Poor $52,835 |
| Ghanaians | 16.1 /100 | #204 | Poor $52,810 |
| Immigrants | Colombia | 15.0 /100 | #205 | Poor $52,725 |
| Immigrants | Iraq | 14.5 /100 | #206 | Poor $52,681 |
| Vietnamese | 12.7 /100 | #207 | Poor $52,525 |
| Venezuelans | 12.5 /100 | #208 | Poor $52,510 |
| Bermudans | 12.1 /100 | #209 | Poor $52,465 |