Albanian vs Immigrants from Uruguay In Labor Force | Age 16-19
COMPARE
Albanian
Immigrants from Uruguay
In Labor Force | Age 16-19
In Labor Force | Age 16-19 Comparison
Albanians
Immigrants from Uruguay
36.5%
IN LABOR FORCE | AGE 16-19
48.8/ 100
METRIC RATING
176th/ 347
METRIC RANK
34.4%
IN LABOR FORCE | AGE 16-19
0.9/ 100
METRIC RATING
264th/ 347
METRIC RANK
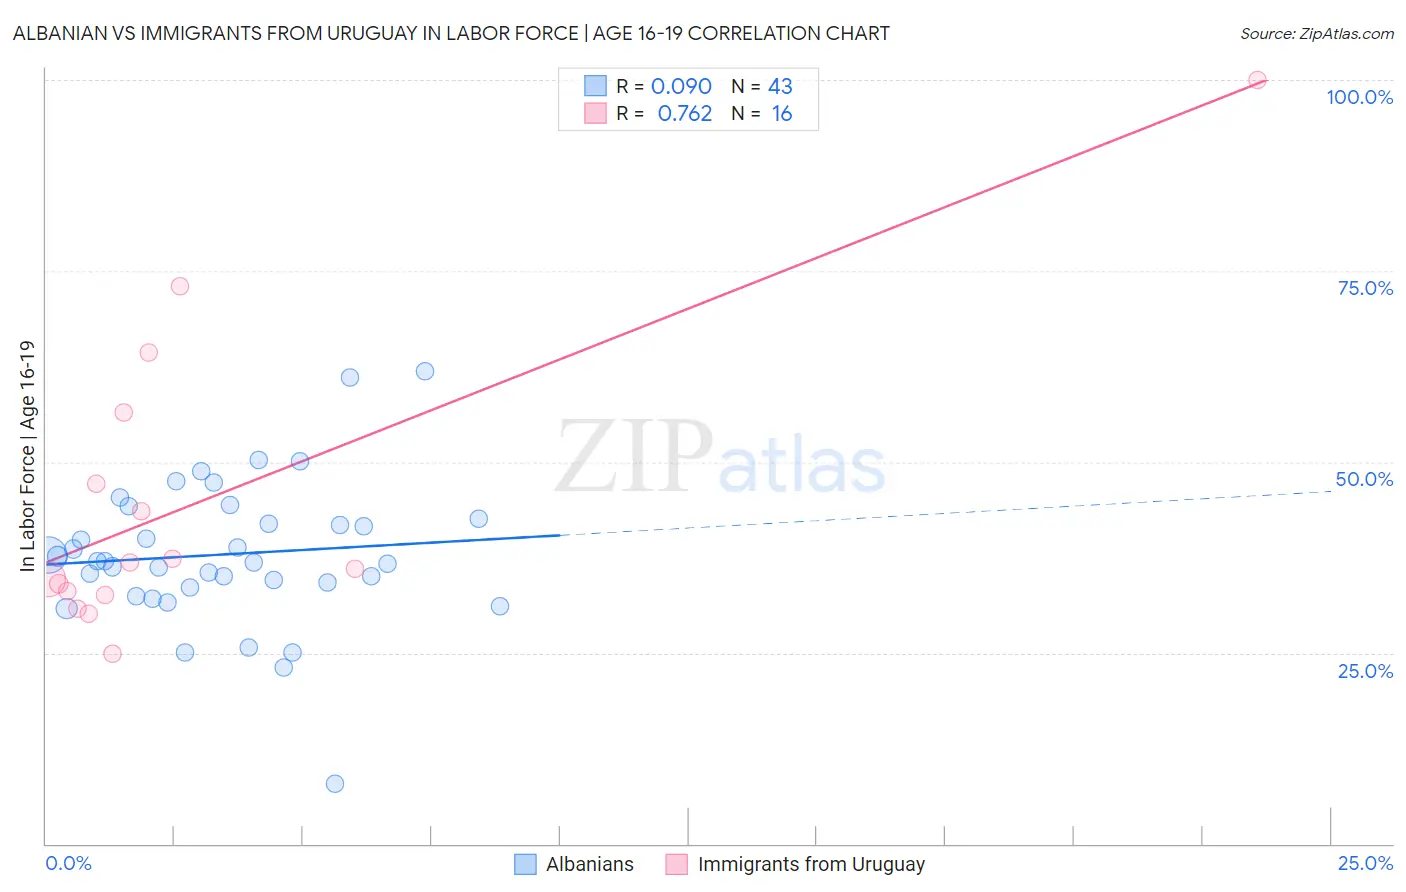
Albanian vs Immigrants from Uruguay In Labor Force | Age 16-19 Correlation Chart
The statistical analysis conducted on geographies consisting of 193,105,340 people shows a slight positive correlation between the proportion of Albanians and labor force participation rate among population between the ages 16 and 19 in the United States with a correlation coefficient (R) of 0.090 and weighted average of 36.5%. Similarly, the statistical analysis conducted on geographies consisting of 133,181,589 people shows a strong positive correlation between the proportion of Immigrants from Uruguay and labor force participation rate among population between the ages 16 and 19 in the United States with a correlation coefficient (R) of 0.762 and weighted average of 34.4%, a difference of 6.3%.
In Labor Force | Age 16-19 Correlation Summary
| Measurement | Albanian | Immigrants from Uruguay |
| Minimum | 7.8% | 24.8% |
| Maximum | 61.9% | 100.0% |
| Range | 54.1% | 75.2% |
| Mean | 37.9% | 44.7% |
| Median | 37.0% | 36.4% |
| Interquartile 25% (IQ1) | 33.5% | 32.8% |
| Interquartile 75% (IQ3) | 42.5% | 51.8% |
| Interquartile Range (IQR) | 9.0% | 19.0% |
| Standard Deviation (Sample) | 9.5% | 19.8% |
| Standard Deviation (Population) | 9.4% | 19.2% |
Similar Demographics by In Labor Force | Age 16-19
Demographics Similar to Albanians by In Labor Force | Age 16-19
In terms of in labor force | age 16-19, the demographic groups most similar to Albanians are Native/Alaskan (36.6%, a difference of 0.010%), Immigrants from Czechoslovakia (36.6%, a difference of 0.060%), Immigrants from Northern Europe (36.5%, a difference of 0.11%), Black/African American (36.5%, a difference of 0.19%), and Immigrants from Southern Europe (36.4%, a difference of 0.28%).
| Demographics | Rating | Rank | In Labor Force | Age 16-19 |
| Immigrants | Latvia | 61.6 /100 | #169 | Good 36.8% |
| Immigrants | South Africa | 60.5 /100 | #170 | Good 36.8% |
| Immigrants | Cambodia | 58.4 /100 | #171 | Average 36.7% |
| South Africans | 58.3 /100 | #172 | Average 36.7% |
| Russians | 57.5 /100 | #173 | Average 36.7% |
| Immigrants | Czechoslovakia | 50.0 /100 | #174 | Average 36.6% |
| Natives/Alaskans | 49.0 /100 | #175 | Average 36.6% |
| Albanians | 48.8 /100 | #176 | Average 36.5% |
| Immigrants | Northern Europe | 46.6 /100 | #177 | Average 36.5% |
| Blacks/African Americans | 45.1 /100 | #178 | Average 36.5% |
| Immigrants | Southern Europe | 43.3 /100 | #179 | Average 36.4% |
| Immigrants | Morocco | 41.1 /100 | #180 | Average 36.4% |
| Jordanians | 39.6 /100 | #181 | Fair 36.4% |
| Immigrants | Italy | 39.1 /100 | #182 | Fair 36.4% |
| Eastern Europeans | 38.8 /100 | #183 | Fair 36.4% |
Demographics Similar to Immigrants from Uruguay by In Labor Force | Age 16-19
In terms of in labor force | age 16-19, the demographic groups most similar to Immigrants from Uruguay are Immigrants from El Salvador (34.3%, a difference of 0.24%), Burmese (34.5%, a difference of 0.28%), Hispanic or Latino (34.5%, a difference of 0.32%), Salvadoran (34.5%, a difference of 0.33%), and Immigrants from Malaysia (34.3%, a difference of 0.33%).
| Demographics | Rating | Rank | In Labor Force | Age 16-19 |
| Immigrants | Egypt | 1.2 /100 | #257 | Tragic 34.6% |
| Thais | 1.2 /100 | #258 | Tragic 34.6% |
| Immigrants | Immigrants | 1.2 /100 | #259 | Tragic 34.6% |
| Egyptians | 1.2 /100 | #260 | Tragic 34.5% |
| Salvadorans | 1.1 /100 | #261 | Tragic 34.5% |
| Hispanics or Latinos | 1.1 /100 | #262 | Tragic 34.5% |
| Burmese | 1.1 /100 | #263 | Tragic 34.5% |
| Immigrants | Uruguay | 0.9 /100 | #264 | Tragic 34.4% |
| Immigrants | El Salvador | 0.7 /100 | #265 | Tragic 34.3% |
| Immigrants | Malaysia | 0.7 /100 | #266 | Tragic 34.3% |
| Immigrants | Peru | 0.5 /100 | #267 | Tragic 34.2% |
| Immigrants | Asia | 0.5 /100 | #268 | Tragic 34.1% |
| Pima | 0.5 /100 | #269 | Tragic 34.1% |
| Immigrants | Russia | 0.4 /100 | #270 | Tragic 34.1% |
| Central American Indians | 0.4 /100 | #271 | Tragic 34.1% |