U.S. Virgin Islander vs Immigrants from Ecuador Median Male Earnings
COMPARE
U.S. Virgin Islander
Immigrants from Ecuador
Median Male Earnings
Median Male Earnings Comparison
U.S. Virgin Islanders
Immigrants from Ecuador
$47,066
MEDIAN MALE EARNINGS
0.1/ 100
METRIC RATING
300th/ 347
METRIC RANK
$50,474
MEDIAN MALE EARNINGS
1.9/ 100
METRIC RATING
246th/ 347
METRIC RANK
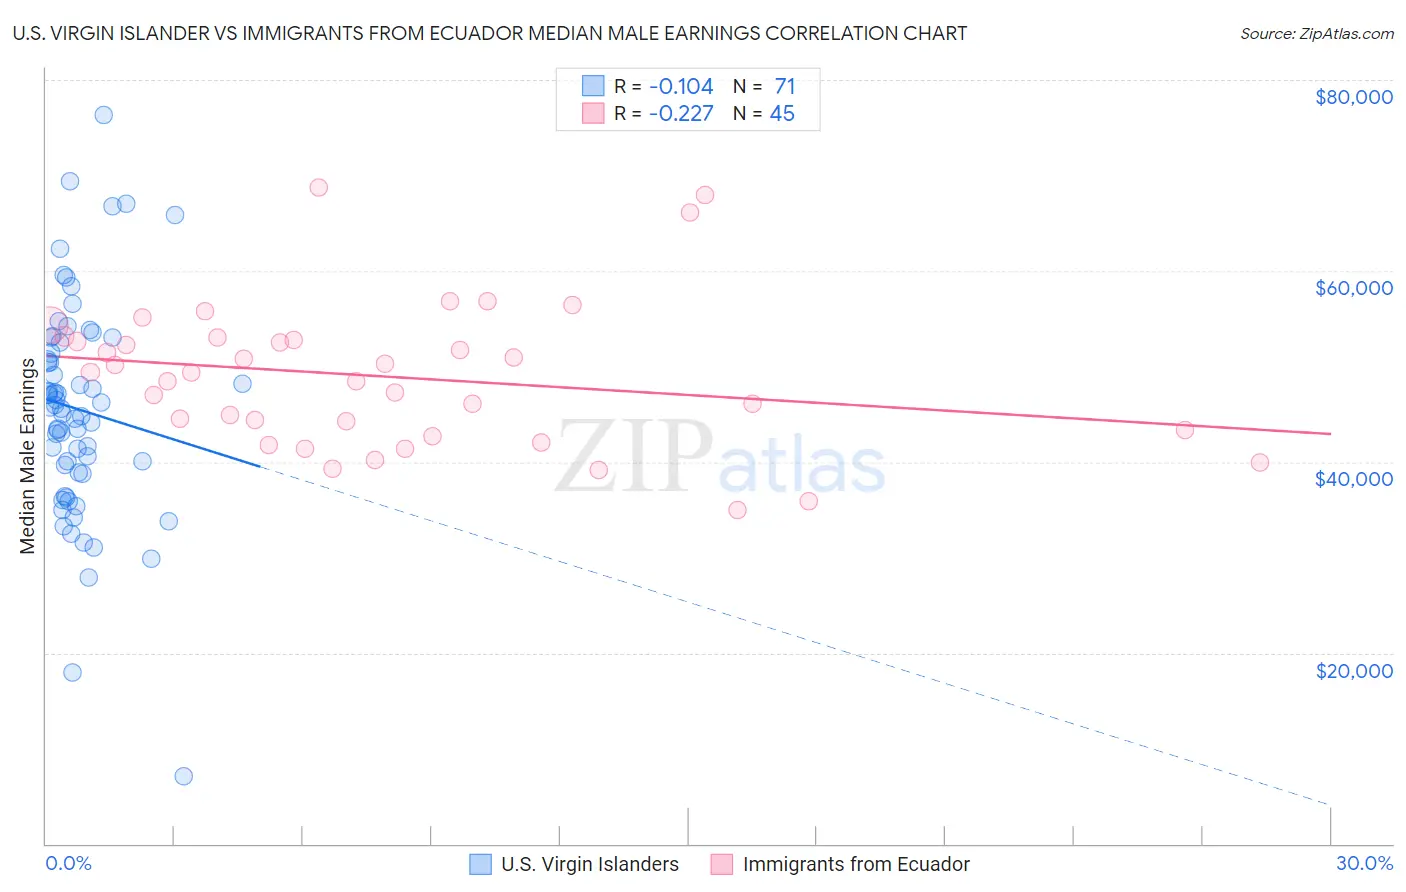
U.S. Virgin Islander vs Immigrants from Ecuador Median Male Earnings Correlation Chart
The statistical analysis conducted on geographies consisting of 87,522,677 people shows a poor negative correlation between the proportion of U.S. Virgin Islanders and median male earnings in the United States with a correlation coefficient (R) of -0.104 and weighted average of $47,066. Similarly, the statistical analysis conducted on geographies consisting of 270,963,841 people shows a weak negative correlation between the proportion of Immigrants from Ecuador and median male earnings in the United States with a correlation coefficient (R) of -0.227 and weighted average of $50,474, a difference of 7.2%.
Median Male Earnings Correlation Summary
| Measurement | U.S. Virgin Islander | Immigrants from Ecuador |
| Minimum | $7,097 | $35,014 |
| Maximum | $76,348 | $68,684 |
| Range | $69,251 | $33,670 |
| Mean | $45,487 | $48,933 |
| Median | $45,658 | $49,320 |
| Interquartile 25% (IQ1) | $38,902 | $42,981 |
| Interquartile 75% (IQ3) | $52,442 | $52,866 |
| Interquartile Range (IQR) | $13,540 | $9,884 |
| Standard Deviation (Sample) | $11,420 | $7,606 |
| Standard Deviation (Population) | $11,340 | $7,521 |
Similar Demographics by Median Male Earnings
Demographics Similar to U.S. Virgin Islanders by Median Male Earnings
In terms of median male earnings, the demographic groups most similar to U.S. Virgin Islanders are Immigrants from Zaire ($47,070, a difference of 0.010%), Immigrants from Micronesia ($47,177, a difference of 0.23%), Immigrants from Latin America ($46,941, a difference of 0.27%), Dominican ($47,204, a difference of 0.29%), and Inupiat ($47,281, a difference of 0.46%).
| Demographics | Rating | Rank | Median Male Earnings |
| Indonesians | 0.1 /100 | #293 | Tragic $47,503 |
| Immigrants | Nicaragua | 0.1 /100 | #294 | Tragic $47,482 |
| Central American Indians | 0.1 /100 | #295 | Tragic $47,433 |
| Inupiat | 0.1 /100 | #296 | Tragic $47,281 |
| Dominicans | 0.1 /100 | #297 | Tragic $47,204 |
| Immigrants | Micronesia | 0.1 /100 | #298 | Tragic $47,177 |
| Immigrants | Zaire | 0.1 /100 | #299 | Tragic $47,070 |
| U.S. Virgin Islanders | 0.1 /100 | #300 | Tragic $47,066 |
| Immigrants | Latin America | 0.1 /100 | #301 | Tragic $46,941 |
| Seminole | 0.1 /100 | #302 | Tragic $46,783 |
| Yaqui | 0.1 /100 | #303 | Tragic $46,777 |
| Bangladeshis | 0.1 /100 | #304 | Tragic $46,744 |
| Guatemalans | 0.0 /100 | #305 | Tragic $46,736 |
| Dutch West Indians | 0.0 /100 | #306 | Tragic $46,656 |
| Immigrants | Dominican Republic | 0.0 /100 | #307 | Tragic $46,655 |
Demographics Similar to Immigrants from Ecuador by Median Male Earnings
In terms of median male earnings, the demographic groups most similar to Immigrants from Ecuador are Hawaiian ($50,488, a difference of 0.030%), Subsaharan African ($50,408, a difference of 0.13%), Houma ($50,547, a difference of 0.14%), Guyanese ($50,613, a difference of 0.27%), and French American Indian ($50,611, a difference of 0.27%).
| Demographics | Rating | Rank | Median Male Earnings |
| Americans | 2.5 /100 | #239 | Tragic $50,761 |
| West Indians | 2.3 /100 | #240 | Tragic $50,682 |
| Immigrants | St. Vincent and the Grenadines | 2.3 /100 | #241 | Tragic $50,665 |
| Guyanese | 2.2 /100 | #242 | Tragic $50,613 |
| French American Indians | 2.2 /100 | #243 | Tragic $50,611 |
| Houma | 2.0 /100 | #244 | Tragic $50,547 |
| Hawaiians | 1.9 /100 | #245 | Tragic $50,488 |
| Immigrants | Ecuador | 1.9 /100 | #246 | Tragic $50,474 |
| Sub-Saharan Africans | 1.8 /100 | #247 | Tragic $50,408 |
| Immigrants | Guyana | 1.6 /100 | #248 | Tragic $50,321 |
| Immigrants | Burma/Myanmar | 1.6 /100 | #249 | Tragic $50,298 |
| Osage | 1.6 /100 | #250 | Tragic $50,292 |
| Immigrants | Grenada | 1.6 /100 | #251 | Tragic $50,279 |
| Immigrants | Cabo Verde | 1.2 /100 | #252 | Tragic $50,009 |
| German Russians | 1.1 /100 | #253 | Tragic $49,924 |