Albanian vs Immigrants from Ecuador Kindergarten
COMPARE
Albanian
Immigrants from Ecuador
Kindergarten
Kindergarten Comparison
Albanians
Immigrants from Ecuador
97.9%
KINDERGARTEN
48.5/ 100
METRIC RATING
176th/ 347
METRIC RANK
96.9%
KINDERGARTEN
0.0/ 100
METRIC RATING
317th/ 347
METRIC RANK
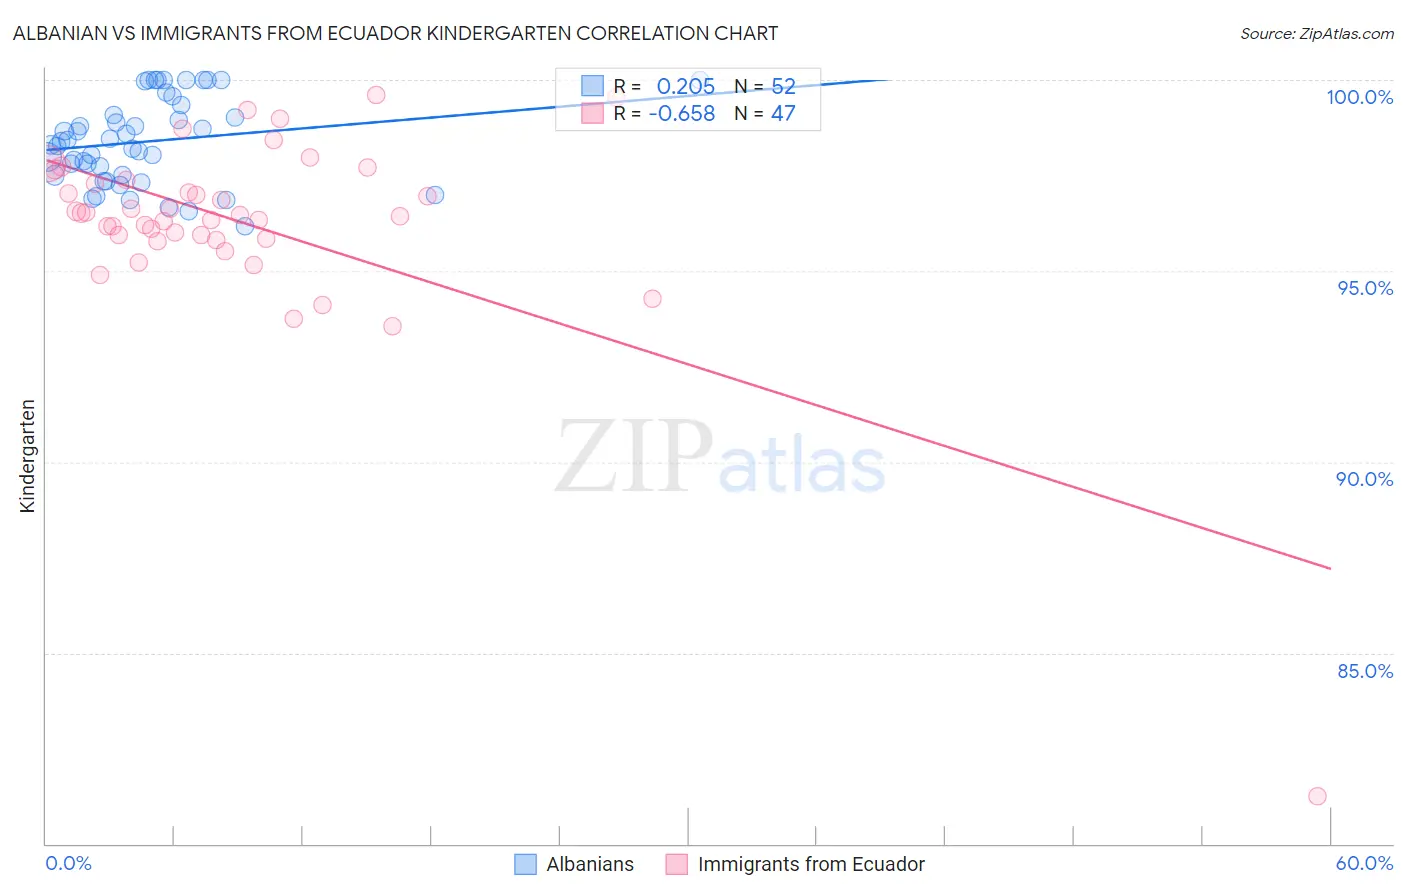
Albanian vs Immigrants from Ecuador Kindergarten Correlation Chart
The statistical analysis conducted on geographies consisting of 193,265,850 people shows a weak positive correlation between the proportion of Albanians and percentage of population with at least kindergarten education in the United States with a correlation coefficient (R) of 0.205 and weighted average of 97.9%. Similarly, the statistical analysis conducted on geographies consisting of 271,020,679 people shows a significant negative correlation between the proportion of Immigrants from Ecuador and percentage of population with at least kindergarten education in the United States with a correlation coefficient (R) of -0.658 and weighted average of 96.9%, a difference of 1.1%.
Kindergarten Correlation Summary
| Measurement | Albanian | Immigrants from Ecuador |
| Minimum | 96.2% | 81.2% |
| Maximum | 100.0% | 99.6% |
| Range | 3.8% | 18.3% |
| Mean | 98.4% | 96.3% |
| Median | 98.3% | 96.5% |
| Interquartile 25% (IQ1) | 97.5% | 95.8% |
| Interquartile 75% (IQ3) | 99.2% | 97.4% |
| Interquartile Range (IQR) | 1.7% | 1.5% |
| Standard Deviation (Sample) | 1.1% | 2.6% |
| Standard Deviation (Population) | 1.1% | 2.6% |
Similar Demographics by Kindergarten
Demographics Similar to Albanians by Kindergarten
In terms of kindergarten, the demographic groups most similar to Albanians are Immigrants from Brazil (98.0%, a difference of 0.0%), Immigrants from Sri Lanka (97.9%, a difference of 0.0%), Immigrants from Venezuela (97.9%, a difference of 0.0%), Brazilian (97.9%, a difference of 0.0%), and Native/Alaskan (98.0%, a difference of 0.010%).
| Demographics | Rating | Rank | Kindergarten |
| Immigrants | Korea | 54.1 /100 | #169 | Average 98.0% |
| Bermudans | 54.0 /100 | #170 | Average 98.0% |
| Immigrants | Jordan | 54.0 /100 | #171 | Average 98.0% |
| Natives/Alaskans | 51.0 /100 | #172 | Average 98.0% |
| Kenyans | 51.0 /100 | #173 | Average 98.0% |
| Immigrants | Brazil | 50.0 /100 | #174 | Average 98.0% |
| Immigrants | Sri Lanka | 49.6 /100 | #175 | Average 97.9% |
| Albanians | 48.5 /100 | #176 | Average 97.9% |
| Immigrants | Venezuela | 47.9 /100 | #177 | Average 97.9% |
| Brazilians | 47.6 /100 | #178 | Average 97.9% |
| Argentineans | 46.8 /100 | #179 | Average 97.9% |
| Immigrants | Bosnia and Herzegovina | 46.7 /100 | #180 | Average 97.9% |
| Portuguese | 43.5 /100 | #181 | Average 97.9% |
| Egyptians | 42.4 /100 | #182 | Average 97.9% |
| Immigrants | Poland | 41.4 /100 | #183 | Average 97.9% |
Demographics Similar to Immigrants from Ecuador by Kindergarten
In terms of kindergarten, the demographic groups most similar to Immigrants from Ecuador are Immigrants from Nicaragua (96.9%, a difference of 0.0%), Immigrants from Belize (96.9%, a difference of 0.010%), Cape Verdean (96.9%, a difference of 0.030%), Honduran (96.9%, a difference of 0.030%), and Guyanese (96.9%, a difference of 0.040%).
| Demographics | Rating | Rank | Kindergarten |
| Immigrants | Azores | 0.0 /100 | #310 | Tragic 97.0% |
| Sri Lankans | 0.0 /100 | #311 | Tragic 97.0% |
| Guyanese | 0.0 /100 | #312 | Tragic 96.9% |
| Cape Verdeans | 0.0 /100 | #313 | Tragic 96.9% |
| Hondurans | 0.0 /100 | #314 | Tragic 96.9% |
| Immigrants | Belize | 0.0 /100 | #315 | Tragic 96.9% |
| Immigrants | Nicaragua | 0.0 /100 | #316 | Tragic 96.9% |
| Immigrants | Ecuador | 0.0 /100 | #317 | Tragic 96.9% |
| Immigrants | Laos | 0.0 /100 | #318 | Tragic 96.9% |
| Immigrants | Guyana | 0.0 /100 | #319 | Tragic 96.8% |
| Immigrants | Burma/Myanmar | 0.0 /100 | #320 | Tragic 96.8% |
| Immigrants | Bangladesh | 0.0 /100 | #321 | Tragic 96.8% |
| Mexican American Indians | 0.0 /100 | #322 | Tragic 96.8% |
| Immigrants | Honduras | 0.0 /100 | #323 | Tragic 96.8% |
| Vietnamese | 0.0 /100 | #324 | Tragic 96.8% |