Belgian vs Immigrants from Ecuador Median Male Earnings
COMPARE
Belgian
Immigrants from Ecuador
Median Male Earnings
Median Male Earnings Comparison
Belgians
Immigrants from Ecuador
$55,361
MEDIAN MALE EARNINGS
70.1/ 100
METRIC RATING
161st/ 347
METRIC RANK
$50,474
MEDIAN MALE EARNINGS
1.9/ 100
METRIC RATING
246th/ 347
METRIC RANK
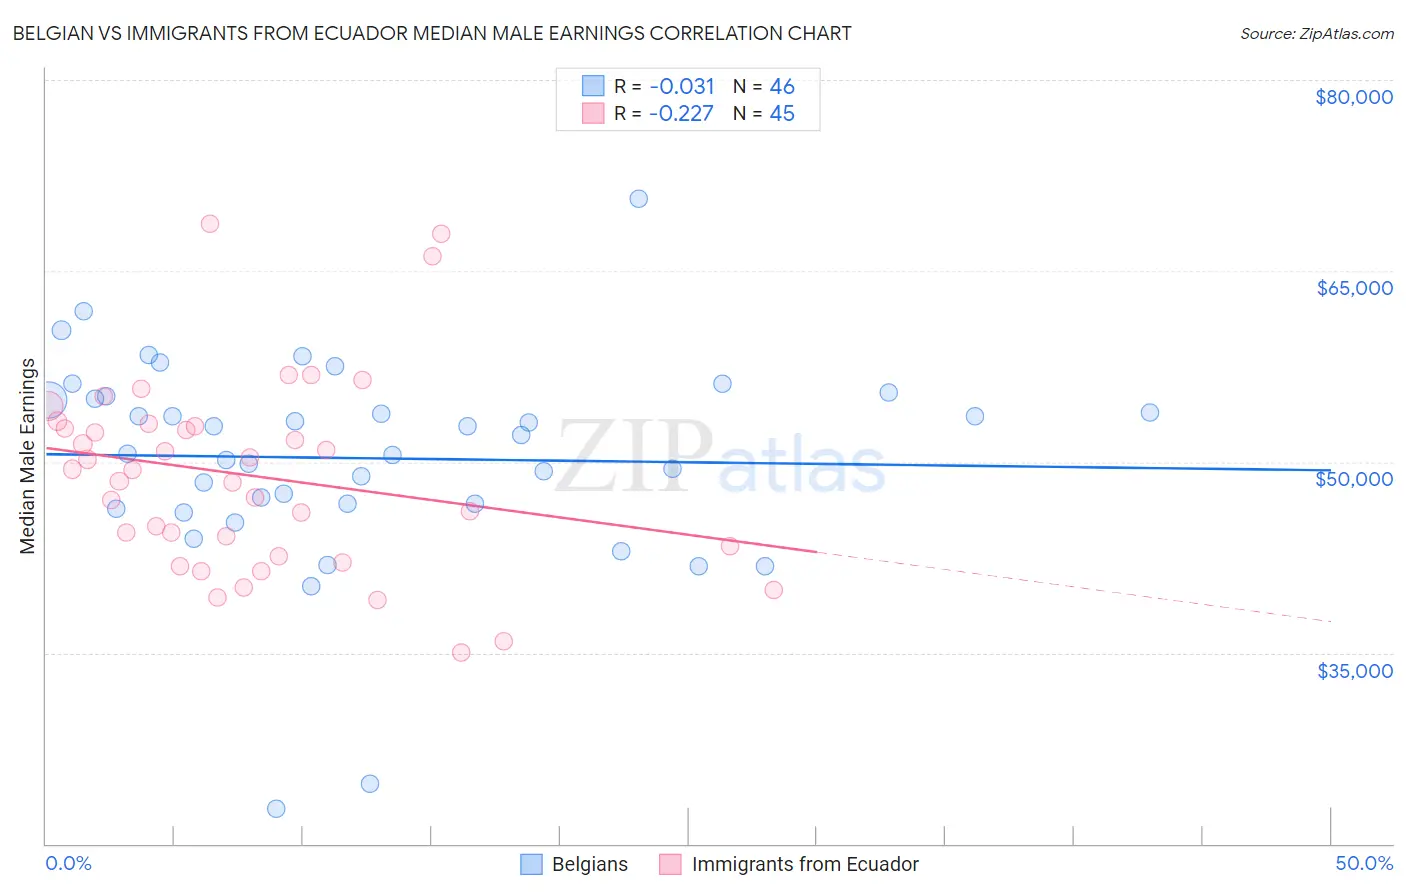
Belgian vs Immigrants from Ecuador Median Male Earnings Correlation Chart
The statistical analysis conducted on geographies consisting of 355,920,572 people shows no correlation between the proportion of Belgians and median male earnings in the United States with a correlation coefficient (R) of -0.031 and weighted average of $55,361. Similarly, the statistical analysis conducted on geographies consisting of 270,963,841 people shows a weak negative correlation between the proportion of Immigrants from Ecuador and median male earnings in the United States with a correlation coefficient (R) of -0.227 and weighted average of $50,474, a difference of 9.7%.
Median Male Earnings Correlation Summary
| Measurement | Belgian | Immigrants from Ecuador |
| Minimum | $22,708 | $35,014 |
| Maximum | $70,714 | $68,684 |
| Range | $48,006 | $33,670 |
| Mean | $50,285 | $48,933 |
| Median | $51,372 | $49,320 |
| Interquartile 25% (IQ1) | $46,719 | $42,981 |
| Interquartile 75% (IQ3) | $54,981 | $52,866 |
| Interquartile Range (IQR) | $8,262 | $9,884 |
| Standard Deviation (Sample) | $8,264 | $7,606 |
| Standard Deviation (Population) | $8,174 | $7,521 |
Similar Demographics by Median Male Earnings
Demographics Similar to Belgians by Median Male Earnings
In terms of median male earnings, the demographic groups most similar to Belgians are Basque ($55,370, a difference of 0.020%), French ($55,350, a difference of 0.020%), Alsatian ($55,380, a difference of 0.030%), Czechoslovakian ($55,382, a difference of 0.040%), and Icelander ($55,415, a difference of 0.10%).
| Demographics | Rating | Rank | Median Male Earnings |
| Taiwanese | 73.9 /100 | #154 | Good $55,556 |
| Scandinavians | 73.4 /100 | #155 | Good $55,527 |
| Immigrants | Ethiopia | 71.6 /100 | #156 | Good $55,434 |
| Icelanders | 71.2 /100 | #157 | Good $55,415 |
| Czechoslovakians | 70.5 /100 | #158 | Good $55,382 |
| Alsatians | 70.5 /100 | #159 | Good $55,380 |
| Basques | 70.3 /100 | #160 | Good $55,370 |
| Belgians | 70.1 /100 | #161 | Good $55,361 |
| French | 69.9 /100 | #162 | Good $55,350 |
| Ugandans | 68.6 /100 | #163 | Good $55,290 |
| Immigrants | South Eastern Asia | 67.6 /100 | #164 | Good $55,241 |
| Immigrants | Portugal | 66.3 /100 | #165 | Good $55,182 |
| Germans | 61.6 /100 | #166 | Good $54,974 |
| Immigrants | Fiji | 61.2 /100 | #167 | Good $54,958 |
| Immigrants | Vietnam | 60.2 /100 | #168 | Good $54,913 |
Demographics Similar to Immigrants from Ecuador by Median Male Earnings
In terms of median male earnings, the demographic groups most similar to Immigrants from Ecuador are Hawaiian ($50,488, a difference of 0.030%), Subsaharan African ($50,408, a difference of 0.13%), Houma ($50,547, a difference of 0.14%), Guyanese ($50,613, a difference of 0.27%), and French American Indian ($50,611, a difference of 0.27%).
| Demographics | Rating | Rank | Median Male Earnings |
| Americans | 2.5 /100 | #239 | Tragic $50,761 |
| West Indians | 2.3 /100 | #240 | Tragic $50,682 |
| Immigrants | St. Vincent and the Grenadines | 2.3 /100 | #241 | Tragic $50,665 |
| Guyanese | 2.2 /100 | #242 | Tragic $50,613 |
| French American Indians | 2.2 /100 | #243 | Tragic $50,611 |
| Houma | 2.0 /100 | #244 | Tragic $50,547 |
| Hawaiians | 1.9 /100 | #245 | Tragic $50,488 |
| Immigrants | Ecuador | 1.9 /100 | #246 | Tragic $50,474 |
| Sub-Saharan Africans | 1.8 /100 | #247 | Tragic $50,408 |
| Immigrants | Guyana | 1.6 /100 | #248 | Tragic $50,321 |
| Immigrants | Burma/Myanmar | 1.6 /100 | #249 | Tragic $50,298 |
| Osage | 1.6 /100 | #250 | Tragic $50,292 |
| Immigrants | Grenada | 1.6 /100 | #251 | Tragic $50,279 |
| Immigrants | Cabo Verde | 1.2 /100 | #252 | Tragic $50,009 |
| German Russians | 1.1 /100 | #253 | Tragic $49,924 |