Alaskan Athabascan vs Immigrants from Sierra Leone Median Male Earnings
COMPARE
Alaskan Athabascan
Immigrants from Sierra Leone
Median Male Earnings
Median Male Earnings Comparison
Alaskan Athabascans
Immigrants from Sierra Leone
$49,748
MEDIAN MALE EARNINGS
0.9/ 100
METRIC RATING
255th/ 347
METRIC RANK
$53,905
MEDIAN MALE EARNINGS
36.0/ 100
METRIC RATING
185th/ 347
METRIC RANK
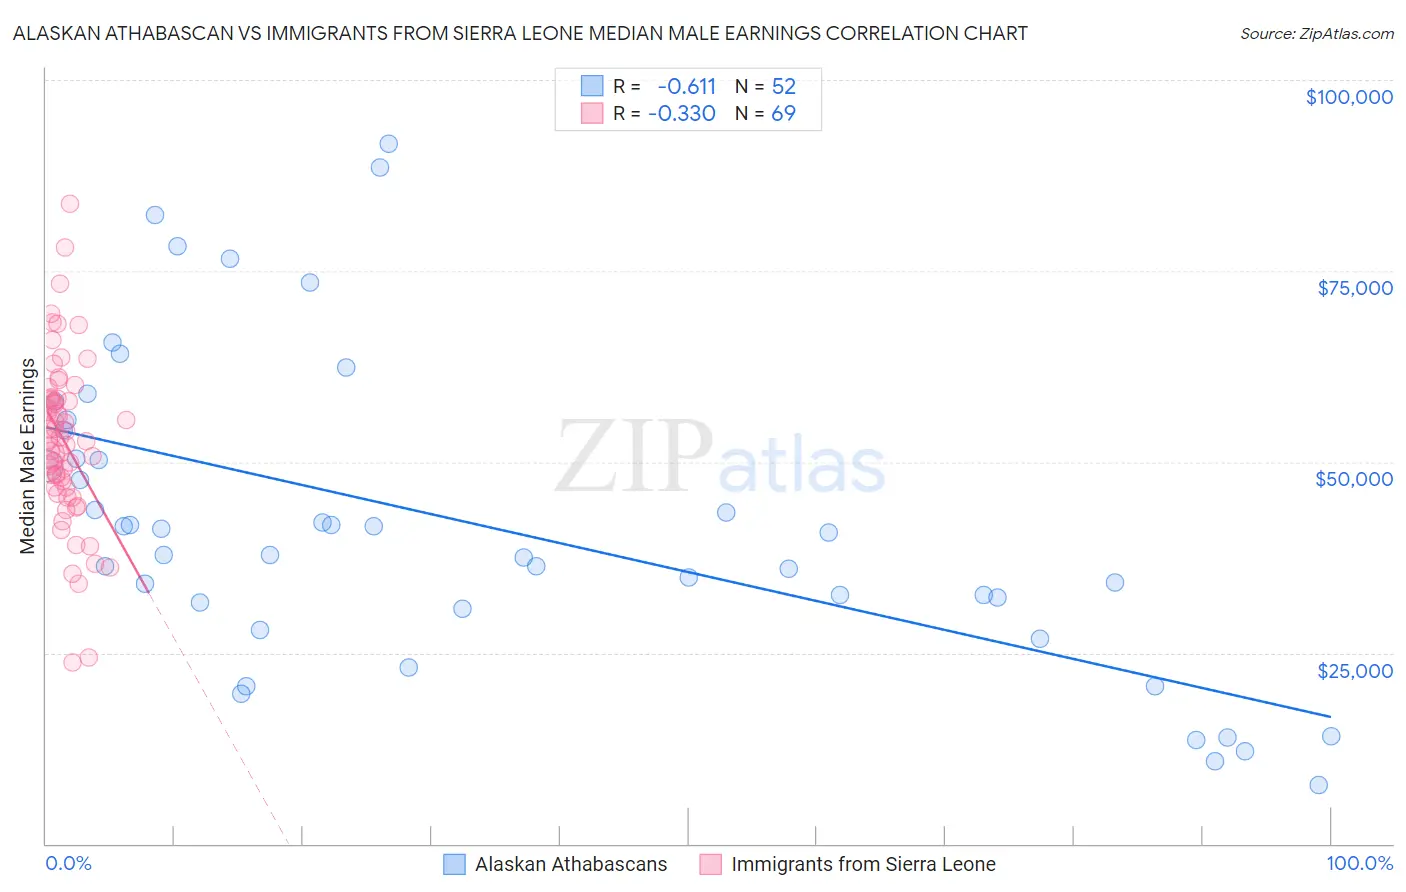
Alaskan Athabascan vs Immigrants from Sierra Leone Median Male Earnings Correlation Chart
The statistical analysis conducted on geographies consisting of 45,804,380 people shows a significant negative correlation between the proportion of Alaskan Athabascans and median male earnings in the United States with a correlation coefficient (R) of -0.611 and weighted average of $49,748. Similarly, the statistical analysis conducted on geographies consisting of 101,648,360 people shows a mild negative correlation between the proportion of Immigrants from Sierra Leone and median male earnings in the United States with a correlation coefficient (R) of -0.330 and weighted average of $53,905, a difference of 8.4%.
Median Male Earnings Correlation Summary
| Measurement | Alaskan Athabascan | Immigrants from Sierra Leone |
| Minimum | $7,708 | $23,693 |
| Maximum | $91,667 | $83,830 |
| Range | $83,959 | $60,137 |
| Mean | $41,933 | $52,734 |
| Median | $39,323 | $52,856 |
| Interquartile 25% (IQ1) | $31,226 | $46,657 |
| Interquartile 75% (IQ3) | $52,255 | $58,267 |
| Interquartile Range (IQR) | $21,029 | $11,610 |
| Standard Deviation (Sample) | $20,193 | $10,929 |
| Standard Deviation (Population) | $19,997 | $10,849 |
Similar Demographics by Median Male Earnings
Demographics Similar to Alaskan Athabascans by Median Male Earnings
In terms of median male earnings, the demographic groups most similar to Alaskan Athabascans are Senegalese ($49,774, a difference of 0.050%), Alaska Native ($49,711, a difference of 0.070%), British West Indian ($49,636, a difference of 0.23%), German Russian ($49,924, a difference of 0.35%), and Cree ($49,497, a difference of 0.51%).
| Demographics | Rating | Rank | Median Male Earnings |
| Immigrants | Guyana | 1.6 /100 | #248 | Tragic $50,321 |
| Immigrants | Burma/Myanmar | 1.6 /100 | #249 | Tragic $50,298 |
| Osage | 1.6 /100 | #250 | Tragic $50,292 |
| Immigrants | Grenada | 1.6 /100 | #251 | Tragic $50,279 |
| Immigrants | Cabo Verde | 1.2 /100 | #252 | Tragic $50,009 |
| German Russians | 1.1 /100 | #253 | Tragic $49,924 |
| Senegalese | 1.0 /100 | #254 | Tragic $49,774 |
| Alaskan Athabascans | 0.9 /100 | #255 | Tragic $49,748 |
| Alaska Natives | 0.9 /100 | #256 | Tragic $49,711 |
| British West Indians | 0.8 /100 | #257 | Tragic $49,636 |
| Cree | 0.7 /100 | #258 | Tragic $49,497 |
| Nepalese | 0.7 /100 | #259 | Tragic $49,458 |
| Iroquois | 0.7 /100 | #260 | Tragic $49,374 |
| Liberians | 0.6 /100 | #261 | Tragic $49,318 |
| Immigrants | West Indies | 0.6 /100 | #262 | Tragic $49,271 |
Demographics Similar to Immigrants from Sierra Leone by Median Male Earnings
In terms of median male earnings, the demographic groups most similar to Immigrants from Sierra Leone are White/Caucasian ($53,925, a difference of 0.040%), Yugoslavian ($53,967, a difference of 0.11%), Immigrants from South America ($53,962, a difference of 0.11%), Colombian ($53,832, a difference of 0.14%), and Immigrants from Eritrea ($53,715, a difference of 0.35%).
| Demographics | Rating | Rank | Median Male Earnings |
| Sierra Leoneans | 44.8 /100 | #178 | Average $54,279 |
| Celtics | 43.9 /100 | #179 | Average $54,242 |
| Iraqis | 42.5 /100 | #180 | Average $54,182 |
| Immigrants | Immigrants | 42.1 /100 | #181 | Average $54,168 |
| Yugoslavians | 37.4 /100 | #182 | Fair $53,967 |
| Immigrants | South America | 37.3 /100 | #183 | Fair $53,962 |
| Whites/Caucasians | 36.5 /100 | #184 | Fair $53,925 |
| Immigrants | Sierra Leone | 36.0 /100 | #185 | Fair $53,905 |
| Colombians | 34.4 /100 | #186 | Fair $53,832 |
| Immigrants | Eritrea | 31.8 /100 | #187 | Fair $53,715 |
| Immigrants | Eastern Africa | 31.8 /100 | #188 | Fair $53,713 |
| Puget Sound Salish | 31.6 /100 | #189 | Fair $53,704 |
| Uruguayans | 31.1 /100 | #190 | Fair $53,680 |
| Guamanians/Chamorros | 30.7 /100 | #191 | Fair $53,661 |
| Scotch-Irish | 30.6 /100 | #192 | Fair $53,658 |