Alaskan Athabascan vs French Canadian Median Male Earnings
COMPARE
Alaskan Athabascan
French Canadian
Median Male Earnings
Median Male Earnings Comparison
Alaskan Athabascans
French Canadians
$49,748
MEDIAN MALE EARNINGS
0.9/ 100
METRIC RATING
255th/ 347
METRIC RANK
$54,722
MEDIAN MALE EARNINGS
55.6/ 100
METRIC RATING
169th/ 347
METRIC RANK
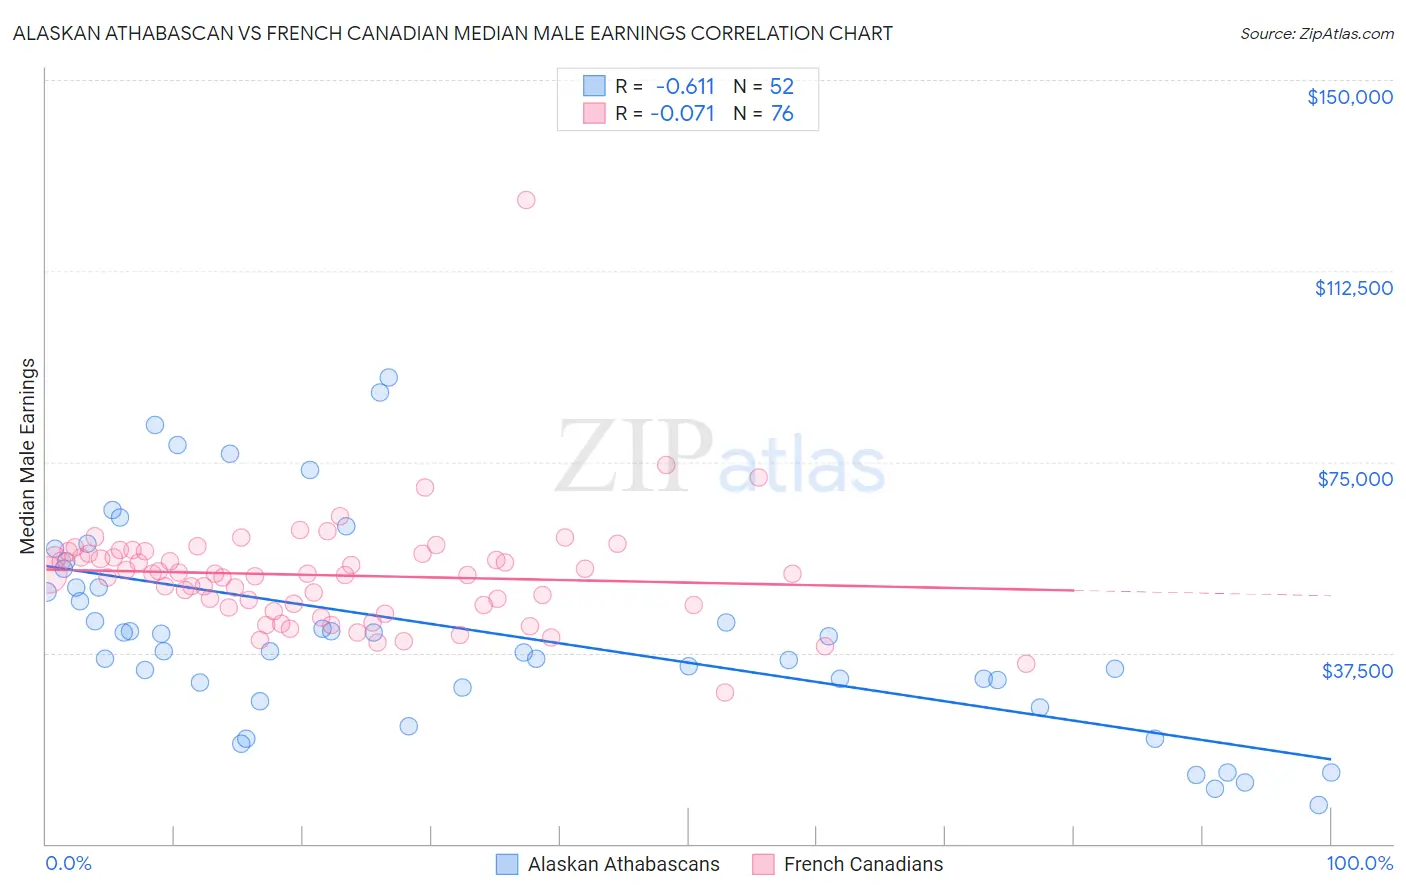
Alaskan Athabascan vs French Canadian Median Male Earnings Correlation Chart
The statistical analysis conducted on geographies consisting of 45,804,380 people shows a significant negative correlation between the proportion of Alaskan Athabascans and median male earnings in the United States with a correlation coefficient (R) of -0.611 and weighted average of $49,748. Similarly, the statistical analysis conducted on geographies consisting of 502,178,853 people shows a slight negative correlation between the proportion of French Canadians and median male earnings in the United States with a correlation coefficient (R) of -0.071 and weighted average of $54,722, a difference of 10.0%.
Median Male Earnings Correlation Summary
| Measurement | Alaskan Athabascan | French Canadian |
| Minimum | $7,708 | $29,821 |
| Maximum | $91,667 | $126,333 |
| Range | $83,959 | $96,512 |
| Mean | $41,933 | $52,728 |
| Median | $39,323 | $52,909 |
| Interquartile 25% (IQ1) | $31,226 | $46,602 |
| Interquartile 75% (IQ3) | $52,255 | $56,878 |
| Interquartile Range (IQR) | $21,029 | $10,277 |
| Standard Deviation (Sample) | $20,193 | $11,742 |
| Standard Deviation (Population) | $19,997 | $11,665 |
Similar Demographics by Median Male Earnings
Demographics Similar to Alaskan Athabascans by Median Male Earnings
In terms of median male earnings, the demographic groups most similar to Alaskan Athabascans are Senegalese ($49,774, a difference of 0.050%), Alaska Native ($49,711, a difference of 0.070%), British West Indian ($49,636, a difference of 0.23%), German Russian ($49,924, a difference of 0.35%), and Cree ($49,497, a difference of 0.51%).
| Demographics | Rating | Rank | Median Male Earnings |
| Immigrants | Guyana | 1.6 /100 | #248 | Tragic $50,321 |
| Immigrants | Burma/Myanmar | 1.6 /100 | #249 | Tragic $50,298 |
| Osage | 1.6 /100 | #250 | Tragic $50,292 |
| Immigrants | Grenada | 1.6 /100 | #251 | Tragic $50,279 |
| Immigrants | Cabo Verde | 1.2 /100 | #252 | Tragic $50,009 |
| German Russians | 1.1 /100 | #253 | Tragic $49,924 |
| Senegalese | 1.0 /100 | #254 | Tragic $49,774 |
| Alaskan Athabascans | 0.9 /100 | #255 | Tragic $49,748 |
| Alaska Natives | 0.9 /100 | #256 | Tragic $49,711 |
| British West Indians | 0.8 /100 | #257 | Tragic $49,636 |
| Cree | 0.7 /100 | #258 | Tragic $49,497 |
| Nepalese | 0.7 /100 | #259 | Tragic $49,458 |
| Iroquois | 0.7 /100 | #260 | Tragic $49,374 |
| Liberians | 0.6 /100 | #261 | Tragic $49,318 |
| Immigrants | West Indies | 0.6 /100 | #262 | Tragic $49,271 |
Demographics Similar to French Canadians by Median Male Earnings
In terms of median male earnings, the demographic groups most similar to French Canadians are Finnish ($54,721, a difference of 0.0%), Immigrants from Peru ($54,695, a difference of 0.050%), Welsh ($54,647, a difference of 0.14%), Immigrants from Vietnam ($54,913, a difference of 0.35%), and South American Indian ($54,508, a difference of 0.39%).
| Demographics | Rating | Rank | Median Male Earnings |
| French | 69.9 /100 | #162 | Good $55,350 |
| Ugandans | 68.6 /100 | #163 | Good $55,290 |
| Immigrants | South Eastern Asia | 67.6 /100 | #164 | Good $55,241 |
| Immigrants | Portugal | 66.3 /100 | #165 | Good $55,182 |
| Germans | 61.6 /100 | #166 | Good $54,974 |
| Immigrants | Fiji | 61.2 /100 | #167 | Good $54,958 |
| Immigrants | Vietnam | 60.2 /100 | #168 | Good $54,913 |
| French Canadians | 55.6 /100 | #169 | Average $54,722 |
| Finns | 55.6 /100 | #170 | Average $54,721 |
| Immigrants | Peru | 54.9 /100 | #171 | Average $54,695 |
| Welsh | 53.8 /100 | #172 | Average $54,647 |
| South American Indians | 50.4 /100 | #173 | Average $54,508 |
| South Americans | 50.0 /100 | #174 | Average $54,492 |
| Dutch | 48.0 /100 | #175 | Average $54,410 |
| Spaniards | 47.8 /100 | #176 | Average $54,401 |