Alaskan Athabascan vs Senegalese Median Male Earnings
COMPARE
Alaskan Athabascan
Senegalese
Median Male Earnings
Median Male Earnings Comparison
Alaskan Athabascans
Senegalese
$49,748
MEDIAN MALE EARNINGS
0.9/ 100
METRIC RATING
255th/ 347
METRIC RANK
$49,774
MEDIAN MALE EARNINGS
1.0/ 100
METRIC RATING
254th/ 347
METRIC RANK
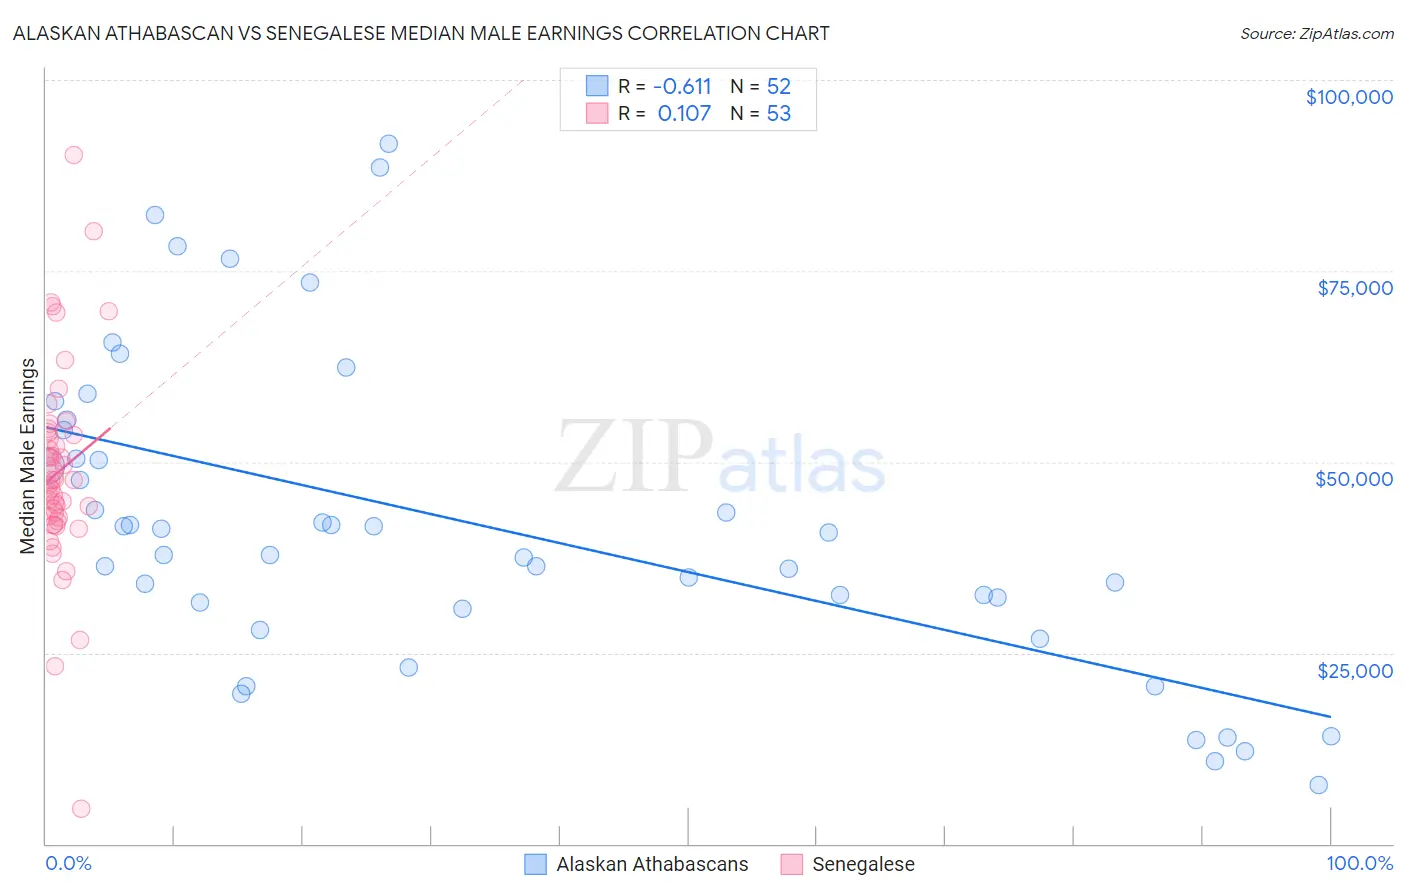
Alaskan Athabascan vs Senegalese Median Male Earnings Correlation Chart
The statistical analysis conducted on geographies consisting of 45,804,380 people shows a significant negative correlation between the proportion of Alaskan Athabascans and median male earnings in the United States with a correlation coefficient (R) of -0.611 and weighted average of $49,748. Similarly, the statistical analysis conducted on geographies consisting of 78,104,359 people shows a poor positive correlation between the proportion of Senegalese and median male earnings in the United States with a correlation coefficient (R) of 0.107 and weighted average of $49,774, a difference of 0.050%.
Median Male Earnings Correlation Summary
| Measurement | Alaskan Athabascan | Senegalese |
| Minimum | $7,708 | $4,513 |
| Maximum | $91,667 | $90,259 |
| Range | $83,959 | $85,746 |
| Mean | $41,933 | $48,737 |
| Median | $39,323 | $47,653 |
| Interquartile 25% (IQ1) | $31,226 | $42,459 |
| Interquartile 75% (IQ3) | $52,255 | $53,697 |
| Interquartile Range (IQR) | $21,029 | $11,239 |
| Standard Deviation (Sample) | $20,193 | $13,453 |
| Standard Deviation (Population) | $19,997 | $13,326 |
Demographics Similar to Alaskan Athabascans and Senegalese by Median Male Earnings
In terms of median male earnings, the demographic groups most similar to Alaskan Athabascans are Alaska Native ($49,711, a difference of 0.070%), British West Indian ($49,636, a difference of 0.23%), German Russian ($49,924, a difference of 0.35%), Cree ($49,497, a difference of 0.51%), and Immigrants from Cabo Verde ($50,009, a difference of 0.52%). Similarly, the demographic groups most similar to Senegalese are Alaska Native ($49,711, a difference of 0.13%), British West Indian ($49,636, a difference of 0.28%), German Russian ($49,924, a difference of 0.30%), Immigrants from Cabo Verde ($50,009, a difference of 0.47%), and Cree ($49,497, a difference of 0.56%).
| Demographics | Rating | Rank | Median Male Earnings |
| Houma | 2.0 /100 | #244 | Tragic $50,547 |
| Hawaiians | 1.9 /100 | #245 | Tragic $50,488 |
| Immigrants | Ecuador | 1.9 /100 | #246 | Tragic $50,474 |
| Sub-Saharan Africans | 1.8 /100 | #247 | Tragic $50,408 |
| Immigrants | Guyana | 1.6 /100 | #248 | Tragic $50,321 |
| Immigrants | Burma/Myanmar | 1.6 /100 | #249 | Tragic $50,298 |
| Osage | 1.6 /100 | #250 | Tragic $50,292 |
| Immigrants | Grenada | 1.6 /100 | #251 | Tragic $50,279 |
| Immigrants | Cabo Verde | 1.2 /100 | #252 | Tragic $50,009 |
| German Russians | 1.1 /100 | #253 | Tragic $49,924 |
| Senegalese | 1.0 /100 | #254 | Tragic $49,774 |
| Alaskan Athabascans | 0.9 /100 | #255 | Tragic $49,748 |
| Alaska Natives | 0.9 /100 | #256 | Tragic $49,711 |
| British West Indians | 0.8 /100 | #257 | Tragic $49,636 |
| Cree | 0.7 /100 | #258 | Tragic $49,497 |
| Nepalese | 0.7 /100 | #259 | Tragic $49,458 |
| Iroquois | 0.7 /100 | #260 | Tragic $49,374 |
| Liberians | 0.6 /100 | #261 | Tragic $49,318 |
| Immigrants | West Indies | 0.6 /100 | #262 | Tragic $49,271 |
| Nicaraguans | 0.6 /100 | #263 | Tragic $49,215 |
| Immigrants | Middle Africa | 0.6 /100 | #264 | Tragic $49,201 |