Alaskan Athabascan vs Sudanese Median Male Earnings
COMPARE
Alaskan Athabascan
Sudanese
Median Male Earnings
Median Male Earnings Comparison
Alaskan Athabascans
Sudanese
$49,748
MEDIAN MALE EARNINGS
0.9/ 100
METRIC RATING
255th/ 347
METRIC RANK
$51,216
MEDIAN MALE EARNINGS
3.9/ 100
METRIC RATING
232nd/ 347
METRIC RANK
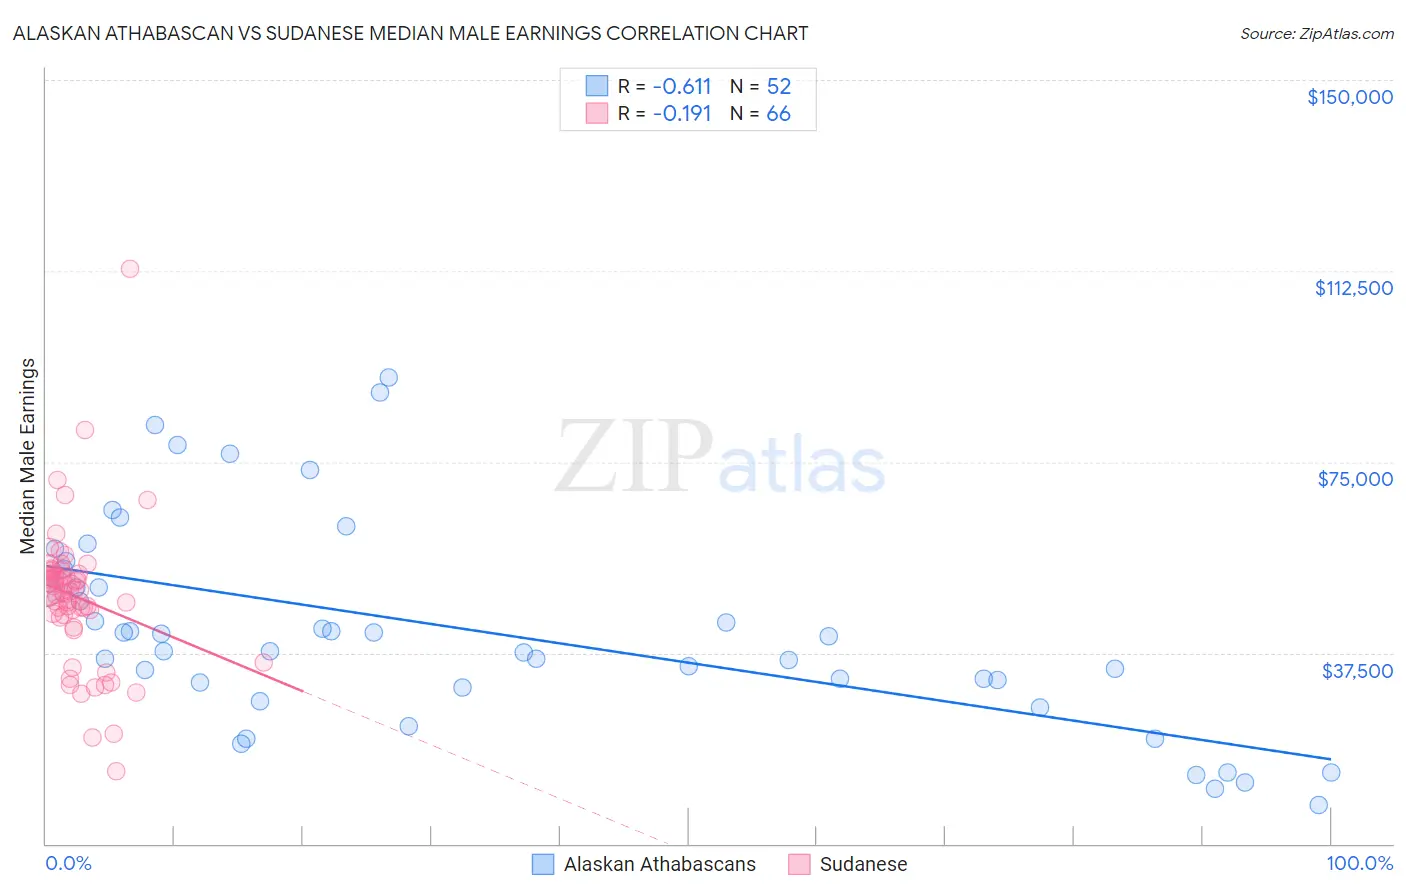
Alaskan Athabascan vs Sudanese Median Male Earnings Correlation Chart
The statistical analysis conducted on geographies consisting of 45,804,380 people shows a significant negative correlation between the proportion of Alaskan Athabascans and median male earnings in the United States with a correlation coefficient (R) of -0.611 and weighted average of $49,748. Similarly, the statistical analysis conducted on geographies consisting of 110,150,959 people shows a poor negative correlation between the proportion of Sudanese and median male earnings in the United States with a correlation coefficient (R) of -0.191 and weighted average of $51,216, a difference of 2.9%.
Median Male Earnings Correlation Summary
| Measurement | Alaskan Athabascan | Sudanese |
| Minimum | $7,708 | $14,310 |
| Maximum | $91,667 | $113,008 |
| Range | $83,959 | $98,698 |
| Mean | $41,933 | $48,489 |
| Median | $39,323 | $49,650 |
| Interquartile 25% (IQ1) | $31,226 | $44,972 |
| Interquartile 75% (IQ3) | $52,255 | $53,130 |
| Interquartile Range (IQR) | $21,029 | $8,158 |
| Standard Deviation (Sample) | $20,193 | $14,082 |
| Standard Deviation (Population) | $19,997 | $13,975 |
Similar Demographics by Median Male Earnings
Demographics Similar to Alaskan Athabascans by Median Male Earnings
In terms of median male earnings, the demographic groups most similar to Alaskan Athabascans are Senegalese ($49,774, a difference of 0.050%), Alaska Native ($49,711, a difference of 0.070%), British West Indian ($49,636, a difference of 0.23%), German Russian ($49,924, a difference of 0.35%), and Cree ($49,497, a difference of 0.51%).
| Demographics | Rating | Rank | Median Male Earnings |
| Immigrants | Guyana | 1.6 /100 | #248 | Tragic $50,321 |
| Immigrants | Burma/Myanmar | 1.6 /100 | #249 | Tragic $50,298 |
| Osage | 1.6 /100 | #250 | Tragic $50,292 |
| Immigrants | Grenada | 1.6 /100 | #251 | Tragic $50,279 |
| Immigrants | Cabo Verde | 1.2 /100 | #252 | Tragic $50,009 |
| German Russians | 1.1 /100 | #253 | Tragic $49,924 |
| Senegalese | 1.0 /100 | #254 | Tragic $49,774 |
| Alaskan Athabascans | 0.9 /100 | #255 | Tragic $49,748 |
| Alaska Natives | 0.9 /100 | #256 | Tragic $49,711 |
| British West Indians | 0.8 /100 | #257 | Tragic $49,636 |
| Cree | 0.7 /100 | #258 | Tragic $49,497 |
| Nepalese | 0.7 /100 | #259 | Tragic $49,458 |
| Iroquois | 0.7 /100 | #260 | Tragic $49,374 |
| Liberians | 0.6 /100 | #261 | Tragic $49,318 |
| Immigrants | West Indies | 0.6 /100 | #262 | Tragic $49,271 |
Demographics Similar to Sudanese by Median Male Earnings
In terms of median male earnings, the demographic groups most similar to Sudanese are Barbadian ($51,236, a difference of 0.040%), Aleut ($51,168, a difference of 0.090%), Immigrants from Nigeria ($51,310, a difference of 0.18%), Cape Verdean ($51,103, a difference of 0.22%), and Immigrants from Trinidad and Tobago ($51,376, a difference of 0.31%).
| Demographics | Rating | Rank | Median Male Earnings |
| Immigrants | Sudan | 5.0 /100 | #225 | Tragic $51,489 |
| Japanese | 4.9 /100 | #226 | Tragic $51,473 |
| Trinidadians and Tobagonians | 4.8 /100 | #227 | Tragic $51,446 |
| Samoans | 4.6 /100 | #228 | Tragic $51,389 |
| Immigrants | Trinidad and Tobago | 4.5 /100 | #229 | Tragic $51,376 |
| Immigrants | Nigeria | 4.2 /100 | #230 | Tragic $51,310 |
| Barbadians | 3.9 /100 | #231 | Tragic $51,236 |
| Sudanese | 3.9 /100 | #232 | Tragic $51,216 |
| Aleuts | 3.7 /100 | #233 | Tragic $51,168 |
| Cape Verdeans | 3.5 /100 | #234 | Tragic $51,103 |
| Immigrants | Western Africa | 3.0 /100 | #235 | Tragic $50,940 |
| Pennsylvania Germans | 2.8 /100 | #236 | Tragic $50,878 |
| Immigrants | Barbados | 2.6 /100 | #237 | Tragic $50,795 |
| Malaysians | 2.5 /100 | #238 | Tragic $50,772 |
| Americans | 2.5 /100 | #239 | Tragic $50,761 |