Alaskan Athabascan vs Immigrants from Sierra Leone Family Households
COMPARE
Alaskan Athabascan
Immigrants from Sierra Leone
Family Households
Family Households Comparison
Alaskan Athabascans
Immigrants from Sierra Leone
61.8%
FAMILY HOUSEHOLDS
0.0/ 100
METRIC RATING
318th/ 347
METRIC RANK
64.3%
FAMILY HOUSEHOLDS
52.5/ 100
METRIC RATING
173rd/ 347
METRIC RANK
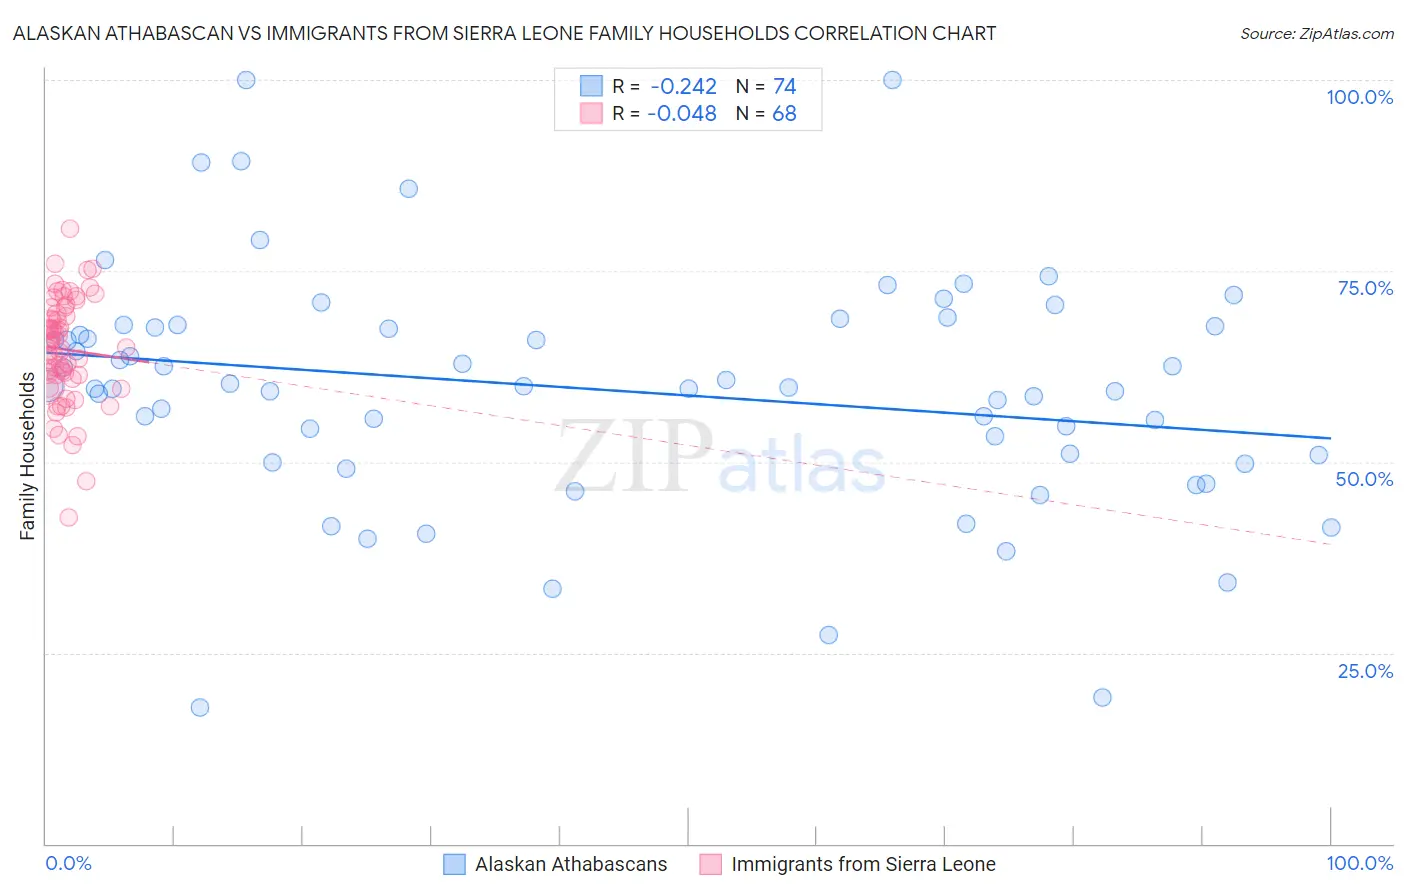
Alaskan Athabascan vs Immigrants from Sierra Leone Family Households Correlation Chart
The statistical analysis conducted on geographies consisting of 45,815,060 people shows a weak negative correlation between the proportion of Alaskan Athabascans and percentage of family households in the United States with a correlation coefficient (R) of -0.242 and weighted average of 61.8%. Similarly, the statistical analysis conducted on geographies consisting of 101,647,201 people shows no correlation between the proportion of Immigrants from Sierra Leone and percentage of family households in the United States with a correlation coefficient (R) of -0.048 and weighted average of 64.3%, a difference of 4.1%.
Family Households Correlation Summary
| Measurement | Alaskan Athabascan | Immigrants from Sierra Leone |
| Minimum | 17.8% | 42.7% |
| Maximum | 100.0% | 80.6% |
| Range | 82.2% | 37.9% |
| Mean | 59.5% | 64.7% |
| Median | 59.8% | 65.3% |
| Interquartile 25% (IQ1) | 50.9% | 61.1% |
| Interquartile 75% (IQ3) | 67.7% | 69.8% |
| Interquartile Range (IQR) | 16.7% | 8.7% |
| Standard Deviation (Sample) | 15.5% | 7.0% |
| Standard Deviation (Population) | 15.4% | 6.9% |
Similar Demographics by Family Households
Demographics Similar to Alaskan Athabascans by Family Households
In terms of family households, the demographic groups most similar to Alaskan Athabascans are Cape Verdean (61.8%, a difference of 0.060%), Immigrants from Bosnia and Herzegovina (61.9%, a difference of 0.080%), Immigrants from Middle Africa (61.9%, a difference of 0.12%), Moroccan (61.9%, a difference of 0.16%), and Ugandan (61.7%, a difference of 0.18%).
| Demographics | Rating | Rank | Family Households |
| Immigrants | Morocco | 0.0 /100 | #311 | Tragic 62.0% |
| Immigrants | Latvia | 0.0 /100 | #312 | Tragic 62.0% |
| Liberians | 0.0 /100 | #313 | Tragic 62.0% |
| Immigrants | Cabo Verde | 0.0 /100 | #314 | Tragic 61.9% |
| Moroccans | 0.0 /100 | #315 | Tragic 61.9% |
| Immigrants | Middle Africa | 0.0 /100 | #316 | Tragic 61.9% |
| Immigrants | Bosnia and Herzegovina | 0.0 /100 | #317 | Tragic 61.9% |
| Alaskan Athabascans | 0.0 /100 | #318 | Tragic 61.8% |
| Cape Verdeans | 0.0 /100 | #319 | Tragic 61.8% |
| Ugandans | 0.0 /100 | #320 | Tragic 61.7% |
| Alsatians | 0.0 /100 | #321 | Tragic 61.7% |
| Immigrants | Serbia | 0.0 /100 | #322 | Tragic 61.6% |
| Tlingit-Haida | 0.0 /100 | #323 | Tragic 61.6% |
| Immigrants | West Indies | 0.0 /100 | #324 | Tragic 61.6% |
| Immigrants | Switzerland | 0.0 /100 | #325 | Tragic 61.6% |
Demographics Similar to Immigrants from Sierra Leone by Family Households
In terms of family households, the demographic groups most similar to Immigrants from Sierra Leone are Dutch West Indian (64.3%, a difference of 0.020%), Ute (64.3%, a difference of 0.030%), Immigrants from Germany (64.3%, a difference of 0.030%), Iraqi (64.4%, a difference of 0.050%), and Armenian (64.4%, a difference of 0.050%).
| Demographics | Rating | Rank | Family Households |
| Scotch-Irish | 59.2 /100 | #166 | Average 64.4% |
| Irish | 57.9 /100 | #167 | Average 64.4% |
| Hondurans | 57.5 /100 | #168 | Average 64.4% |
| Iraqis | 56.0 /100 | #169 | Average 64.4% |
| Armenians | 55.9 /100 | #170 | Average 64.4% |
| Ute | 54.6 /100 | #171 | Average 64.3% |
| Dutch West Indians | 53.9 /100 | #172 | Average 64.3% |
| Immigrants | Sierra Leone | 52.5 /100 | #173 | Average 64.3% |
| Immigrants | Germany | 50.0 /100 | #174 | Average 64.3% |
| Bangladeshis | 44.3 /100 | #175 | Average 64.3% |
| Vietnamese | 43.6 /100 | #176 | Average 64.2% |
| Immigrants | Micronesia | 42.3 /100 | #177 | Average 64.2% |
| Jamaicans | 40.6 /100 | #178 | Average 64.2% |
| Immigrants | Ukraine | 38.2 /100 | #179 | Fair 64.2% |
| Immigrants | Honduras | 35.0 /100 | #180 | Fair 64.2% |