Alaskan Athabascan vs Immigrants from Eastern Asia Median Male Earnings
COMPARE
Alaskan Athabascan
Immigrants from Eastern Asia
Median Male Earnings
Median Male Earnings Comparison
Alaskan Athabascans
Immigrants from Eastern Asia
$49,748
MEDIAN MALE EARNINGS
0.9/ 100
METRIC RATING
255th/ 347
METRIC RANK
$66,903
MEDIAN MALE EARNINGS
100.0/ 100
METRIC RATING
15th/ 347
METRIC RANK
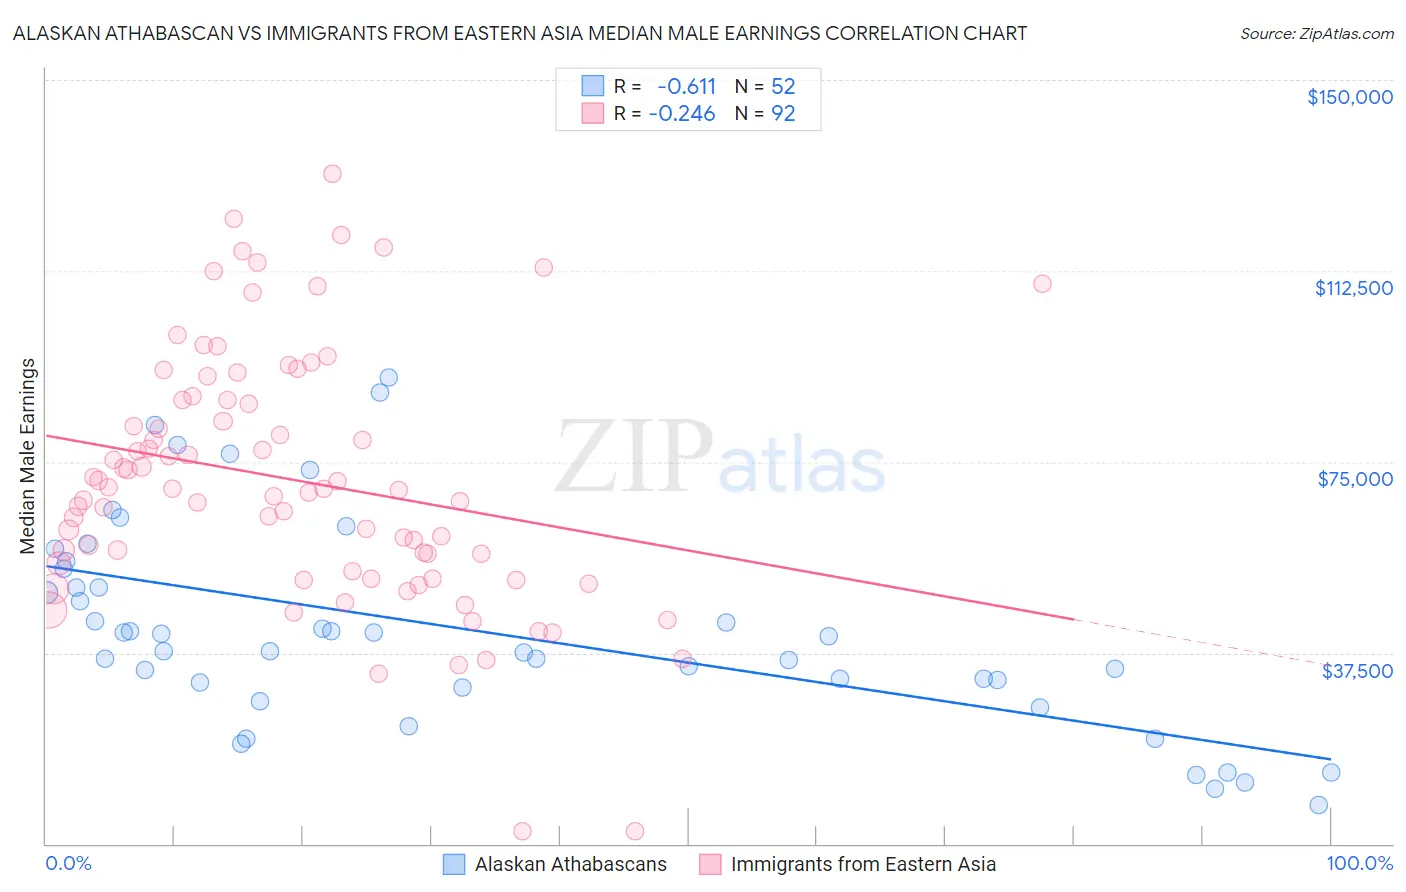
Alaskan Athabascan vs Immigrants from Eastern Asia Median Male Earnings Correlation Chart
The statistical analysis conducted on geographies consisting of 45,804,380 people shows a significant negative correlation between the proportion of Alaskan Athabascans and median male earnings in the United States with a correlation coefficient (R) of -0.611 and weighted average of $49,748. Similarly, the statistical analysis conducted on geographies consisting of 499,639,394 people shows a weak negative correlation between the proportion of Immigrants from Eastern Asia and median male earnings in the United States with a correlation coefficient (R) of -0.246 and weighted average of $66,903, a difference of 34.5%.
Median Male Earnings Correlation Summary
| Measurement | Alaskan Athabascan | Immigrants from Eastern Asia |
| Minimum | $7,708 | $2,499 |
| Maximum | $91,667 | $131,653 |
| Range | $83,959 | $129,154 |
| Mean | $41,933 | $71,397 |
| Median | $39,323 | $69,591 |
| Interquartile 25% (IQ1) | $31,226 | $54,279 |
| Interquartile 75% (IQ3) | $52,255 | $87,124 |
| Interquartile Range (IQR) | $21,029 | $32,845 |
| Standard Deviation (Sample) | $20,193 | $24,831 |
| Standard Deviation (Population) | $19,997 | $24,695 |
Similar Demographics by Median Male Earnings
Demographics Similar to Alaskan Athabascans by Median Male Earnings
In terms of median male earnings, the demographic groups most similar to Alaskan Athabascans are Senegalese ($49,774, a difference of 0.050%), Alaska Native ($49,711, a difference of 0.070%), British West Indian ($49,636, a difference of 0.23%), German Russian ($49,924, a difference of 0.35%), and Cree ($49,497, a difference of 0.51%).
| Demographics | Rating | Rank | Median Male Earnings |
| Immigrants | Guyana | 1.6 /100 | #248 | Tragic $50,321 |
| Immigrants | Burma/Myanmar | 1.6 /100 | #249 | Tragic $50,298 |
| Osage | 1.6 /100 | #250 | Tragic $50,292 |
| Immigrants | Grenada | 1.6 /100 | #251 | Tragic $50,279 |
| Immigrants | Cabo Verde | 1.2 /100 | #252 | Tragic $50,009 |
| German Russians | 1.1 /100 | #253 | Tragic $49,924 |
| Senegalese | 1.0 /100 | #254 | Tragic $49,774 |
| Alaskan Athabascans | 0.9 /100 | #255 | Tragic $49,748 |
| Alaska Natives | 0.9 /100 | #256 | Tragic $49,711 |
| British West Indians | 0.8 /100 | #257 | Tragic $49,636 |
| Cree | 0.7 /100 | #258 | Tragic $49,497 |
| Nepalese | 0.7 /100 | #259 | Tragic $49,458 |
| Iroquois | 0.7 /100 | #260 | Tragic $49,374 |
| Liberians | 0.6 /100 | #261 | Tragic $49,318 |
| Immigrants | West Indies | 0.6 /100 | #262 | Tragic $49,271 |
Demographics Similar to Immigrants from Eastern Asia by Median Male Earnings
In terms of median male earnings, the demographic groups most similar to Immigrants from Eastern Asia are Okinawan ($67,232, a difference of 0.49%), Eastern European ($66,472, a difference of 0.65%), Immigrants from China ($67,353, a difference of 0.67%), Immigrants from Australia ($67,634, a difference of 1.1%), and Immigrants from Belgium ($66,125, a difference of 1.2%).
| Demographics | Rating | Rank | Median Male Earnings |
| Immigrants | Iran | 100.0 /100 | #8 | Exceptional $69,284 |
| Immigrants | South Central Asia | 100.0 /100 | #9 | Exceptional $68,960 |
| Immigrants | Israel | 100.0 /100 | #10 | Exceptional $68,716 |
| Immigrants | Ireland | 100.0 /100 | #11 | Exceptional $67,698 |
| Immigrants | Australia | 100.0 /100 | #12 | Exceptional $67,634 |
| Immigrants | China | 100.0 /100 | #13 | Exceptional $67,353 |
| Okinawans | 100.0 /100 | #14 | Exceptional $67,232 |
| Immigrants | Eastern Asia | 100.0 /100 | #15 | Exceptional $66,903 |
| Eastern Europeans | 100.0 /100 | #16 | Exceptional $66,472 |
| Immigrants | Belgium | 100.0 /100 | #17 | Exceptional $66,125 |
| Indians (Asian) | 100.0 /100 | #18 | Exceptional $66,078 |
| Cypriots | 100.0 /100 | #19 | Exceptional $65,549 |
| Immigrants | Japan | 100.0 /100 | #20 | Exceptional $65,518 |
| Immigrants | Sweden | 100.0 /100 | #21 | Exceptional $65,406 |
| Burmese | 100.0 /100 | #22 | Exceptional $65,236 |