Spaniard vs Immigrants from Sierra Leone Median Male Earnings
COMPARE
Spaniard
Immigrants from Sierra Leone
Median Male Earnings
Median Male Earnings Comparison
Spaniards
Immigrants from Sierra Leone
$54,401
MEDIAN MALE EARNINGS
47.8/ 100
METRIC RATING
176th/ 347
METRIC RANK
$53,905
MEDIAN MALE EARNINGS
36.0/ 100
METRIC RATING
185th/ 347
METRIC RANK
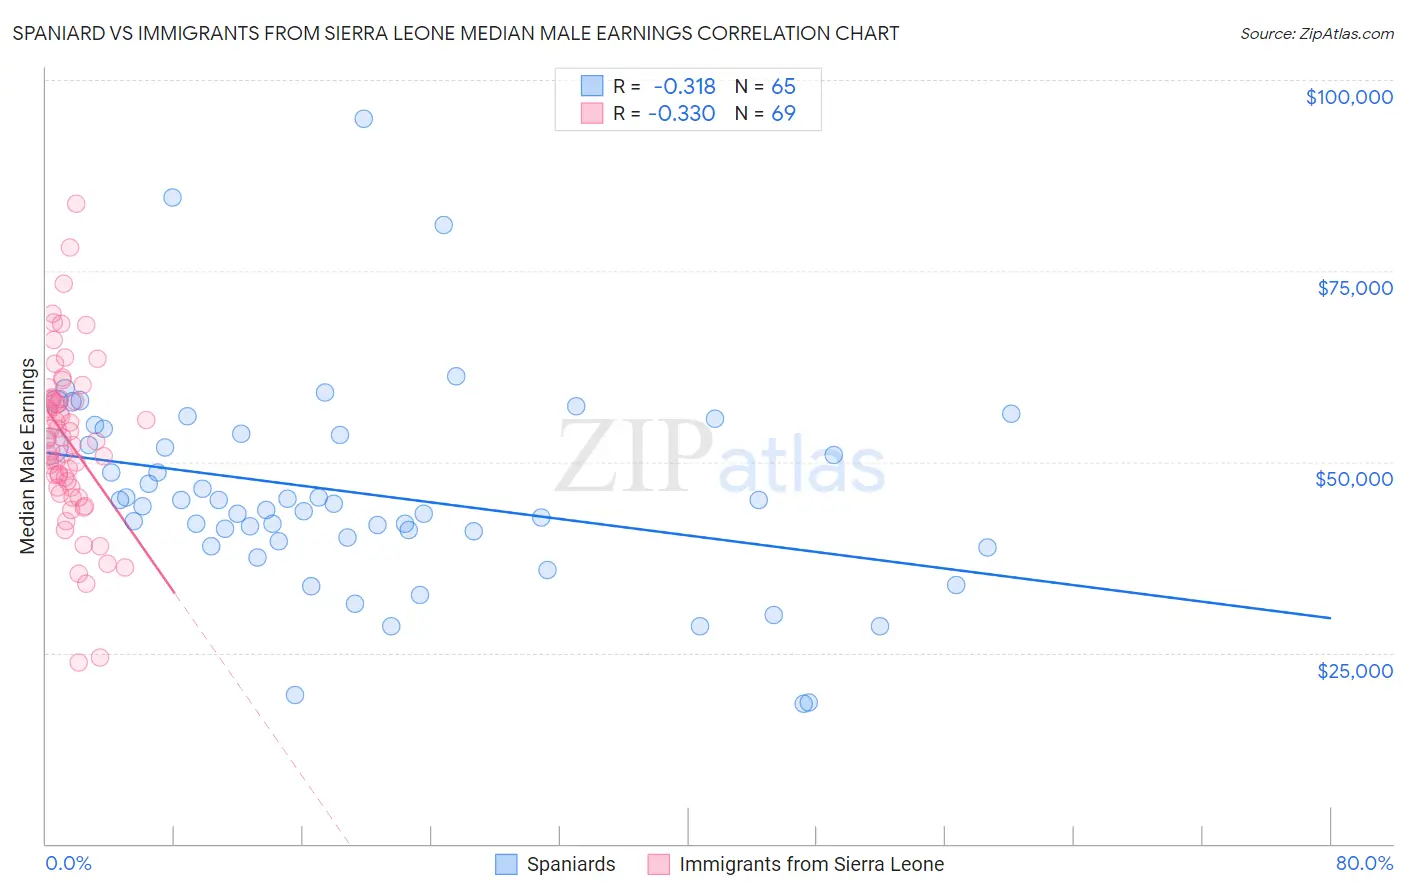
Spaniard vs Immigrants from Sierra Leone Median Male Earnings Correlation Chart
The statistical analysis conducted on geographies consisting of 443,330,517 people shows a mild negative correlation between the proportion of Spaniards and median male earnings in the United States with a correlation coefficient (R) of -0.318 and weighted average of $54,401. Similarly, the statistical analysis conducted on geographies consisting of 101,648,360 people shows a mild negative correlation between the proportion of Immigrants from Sierra Leone and median male earnings in the United States with a correlation coefficient (R) of -0.330 and weighted average of $53,905, a difference of 0.92%.
Median Male Earnings Correlation Summary
| Measurement | Spaniard | Immigrants from Sierra Leone |
| Minimum | $18,319 | $23,693 |
| Maximum | $95,000 | $83,830 |
| Range | $76,681 | $60,137 |
| Mean | $45,902 | $52,734 |
| Median | $44,474 | $52,856 |
| Interquartile 25% (IQ1) | $39,886 | $46,657 |
| Interquartile 75% (IQ3) | $53,625 | $58,267 |
| Interquartile Range (IQR) | $13,740 | $11,610 |
| Standard Deviation (Sample) | $13,482 | $10,929 |
| Standard Deviation (Population) | $13,378 | $10,849 |
Demographics Similar to Spaniards and Immigrants from Sierra Leone by Median Male Earnings
In terms of median male earnings, the demographic groups most similar to Spaniards are Dutch ($54,410, a difference of 0.020%), South American ($54,492, a difference of 0.17%), South American Indian ($54,508, a difference of 0.20%), Costa Rican ($54,279, a difference of 0.22%), and Sierra Leonean ($54,279, a difference of 0.22%). Similarly, the demographic groups most similar to Immigrants from Sierra Leone are White/Caucasian ($53,925, a difference of 0.040%), Yugoslavian ($53,967, a difference of 0.11%), Immigrants from South America ($53,962, a difference of 0.11%), Colombian ($53,832, a difference of 0.14%), and Immigrants from Eritrea ($53,715, a difference of 0.35%).
| Demographics | Rating | Rank | Median Male Earnings |
| Finns | 55.6 /100 | #170 | Average $54,721 |
| Immigrants | Peru | 54.9 /100 | #171 | Average $54,695 |
| Welsh | 53.8 /100 | #172 | Average $54,647 |
| South American Indians | 50.4 /100 | #173 | Average $54,508 |
| South Americans | 50.0 /100 | #174 | Average $54,492 |
| Dutch | 48.0 /100 | #175 | Average $54,410 |
| Spaniards | 47.8 /100 | #176 | Average $54,401 |
| Costa Ricans | 44.8 /100 | #177 | Average $54,279 |
| Sierra Leoneans | 44.8 /100 | #178 | Average $54,279 |
| Celtics | 43.9 /100 | #179 | Average $54,242 |
| Iraqis | 42.5 /100 | #180 | Average $54,182 |
| Immigrants | Immigrants | 42.1 /100 | #181 | Average $54,168 |
| Yugoslavians | 37.4 /100 | #182 | Fair $53,967 |
| Immigrants | South America | 37.3 /100 | #183 | Fair $53,962 |
| Whites/Caucasians | 36.5 /100 | #184 | Fair $53,925 |
| Immigrants | Sierra Leone | 36.0 /100 | #185 | Fair $53,905 |
| Colombians | 34.4 /100 | #186 | Fair $53,832 |
| Immigrants | Eritrea | 31.8 /100 | #187 | Fair $53,715 |
| Immigrants | Eastern Africa | 31.8 /100 | #188 | Fair $53,713 |
| Puget Sound Salish | 31.6 /100 | #189 | Fair $53,704 |
| Uruguayans | 31.1 /100 | #190 | Fair $53,680 |