Alaskan Athabascan vs Immigrants from Barbados Median Male Earnings
COMPARE
Alaskan Athabascan
Immigrants from Barbados
Median Male Earnings
Median Male Earnings Comparison
Alaskan Athabascans
Immigrants from Barbados
$49,748
MEDIAN MALE EARNINGS
0.9/ 100
METRIC RATING
255th/ 347
METRIC RANK
$50,795
MEDIAN MALE EARNINGS
2.6/ 100
METRIC RATING
237th/ 347
METRIC RANK
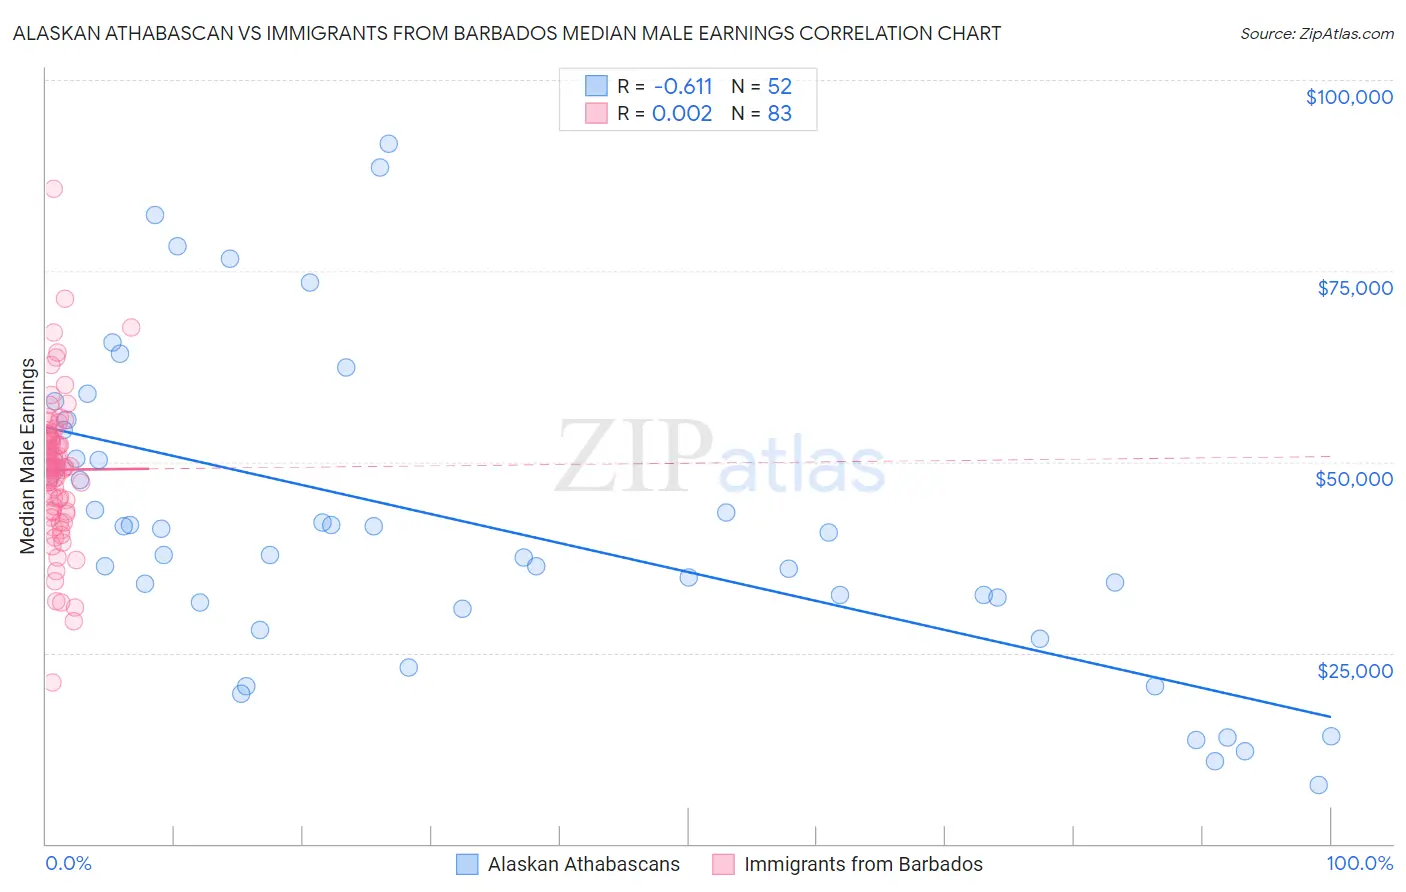
Alaskan Athabascan vs Immigrants from Barbados Median Male Earnings Correlation Chart
The statistical analysis conducted on geographies consisting of 45,804,380 people shows a significant negative correlation between the proportion of Alaskan Athabascans and median male earnings in the United States with a correlation coefficient (R) of -0.611 and weighted average of $49,748. Similarly, the statistical analysis conducted on geographies consisting of 112,696,118 people shows no correlation between the proportion of Immigrants from Barbados and median male earnings in the United States with a correlation coefficient (R) of 0.002 and weighted average of $50,795, a difference of 2.1%.
Median Male Earnings Correlation Summary
| Measurement | Alaskan Athabascan | Immigrants from Barbados |
| Minimum | $7,708 | $21,184 |
| Maximum | $91,667 | $85,682 |
| Range | $83,959 | $64,498 |
| Mean | $41,933 | $48,967 |
| Median | $39,323 | $49,260 |
| Interquartile 25% (IQ1) | $31,226 | $43,464 |
| Interquartile 75% (IQ3) | $52,255 | $53,363 |
| Interquartile Range (IQR) | $21,029 | $9,899 |
| Standard Deviation (Sample) | $20,193 | $9,605 |
| Standard Deviation (Population) | $19,997 | $9,547 |
Demographics Similar to Alaskan Athabascans and Immigrants from Barbados by Median Male Earnings
In terms of median male earnings, the demographic groups most similar to Alaskan Athabascans are Senegalese ($49,774, a difference of 0.050%), Alaska Native ($49,711, a difference of 0.070%), German Russian ($49,924, a difference of 0.35%), Immigrants from Cabo Verde ($50,009, a difference of 0.52%), and Immigrants from Grenada ($50,279, a difference of 1.1%). Similarly, the demographic groups most similar to Immigrants from Barbados are Malaysian ($50,772, a difference of 0.050%), American ($50,761, a difference of 0.070%), Pennsylvania German ($50,878, a difference of 0.16%), West Indian ($50,682, a difference of 0.22%), and Immigrants from St. Vincent and the Grenadines ($50,665, a difference of 0.26%).
| Demographics | Rating | Rank | Median Male Earnings |
| Pennsylvania Germans | 2.8 /100 | #236 | Tragic $50,878 |
| Immigrants | Barbados | 2.6 /100 | #237 | Tragic $50,795 |
| Malaysians | 2.5 /100 | #238 | Tragic $50,772 |
| Americans | 2.5 /100 | #239 | Tragic $50,761 |
| West Indians | 2.3 /100 | #240 | Tragic $50,682 |
| Immigrants | St. Vincent and the Grenadines | 2.3 /100 | #241 | Tragic $50,665 |
| Guyanese | 2.2 /100 | #242 | Tragic $50,613 |
| French American Indians | 2.2 /100 | #243 | Tragic $50,611 |
| Houma | 2.0 /100 | #244 | Tragic $50,547 |
| Hawaiians | 1.9 /100 | #245 | Tragic $50,488 |
| Immigrants | Ecuador | 1.9 /100 | #246 | Tragic $50,474 |
| Sub-Saharan Africans | 1.8 /100 | #247 | Tragic $50,408 |
| Immigrants | Guyana | 1.6 /100 | #248 | Tragic $50,321 |
| Immigrants | Burma/Myanmar | 1.6 /100 | #249 | Tragic $50,298 |
| Osage | 1.6 /100 | #250 | Tragic $50,292 |
| Immigrants | Grenada | 1.6 /100 | #251 | Tragic $50,279 |
| Immigrants | Cabo Verde | 1.2 /100 | #252 | Tragic $50,009 |
| German Russians | 1.1 /100 | #253 | Tragic $49,924 |
| Senegalese | 1.0 /100 | #254 | Tragic $49,774 |
| Alaskan Athabascans | 0.9 /100 | #255 | Tragic $49,748 |
| Alaska Natives | 0.9 /100 | #256 | Tragic $49,711 |