Alaskan Athabascan vs Jordanian Median Male Earnings
COMPARE
Alaskan Athabascan
Jordanian
Median Male Earnings
Median Male Earnings Comparison
Alaskan Athabascans
Jordanians
$49,748
MEDIAN MALE EARNINGS
0.9/ 100
METRIC RATING
255th/ 347
METRIC RANK
$58,500
MEDIAN MALE EARNINGS
98.1/ 100
METRIC RATING
98th/ 347
METRIC RANK
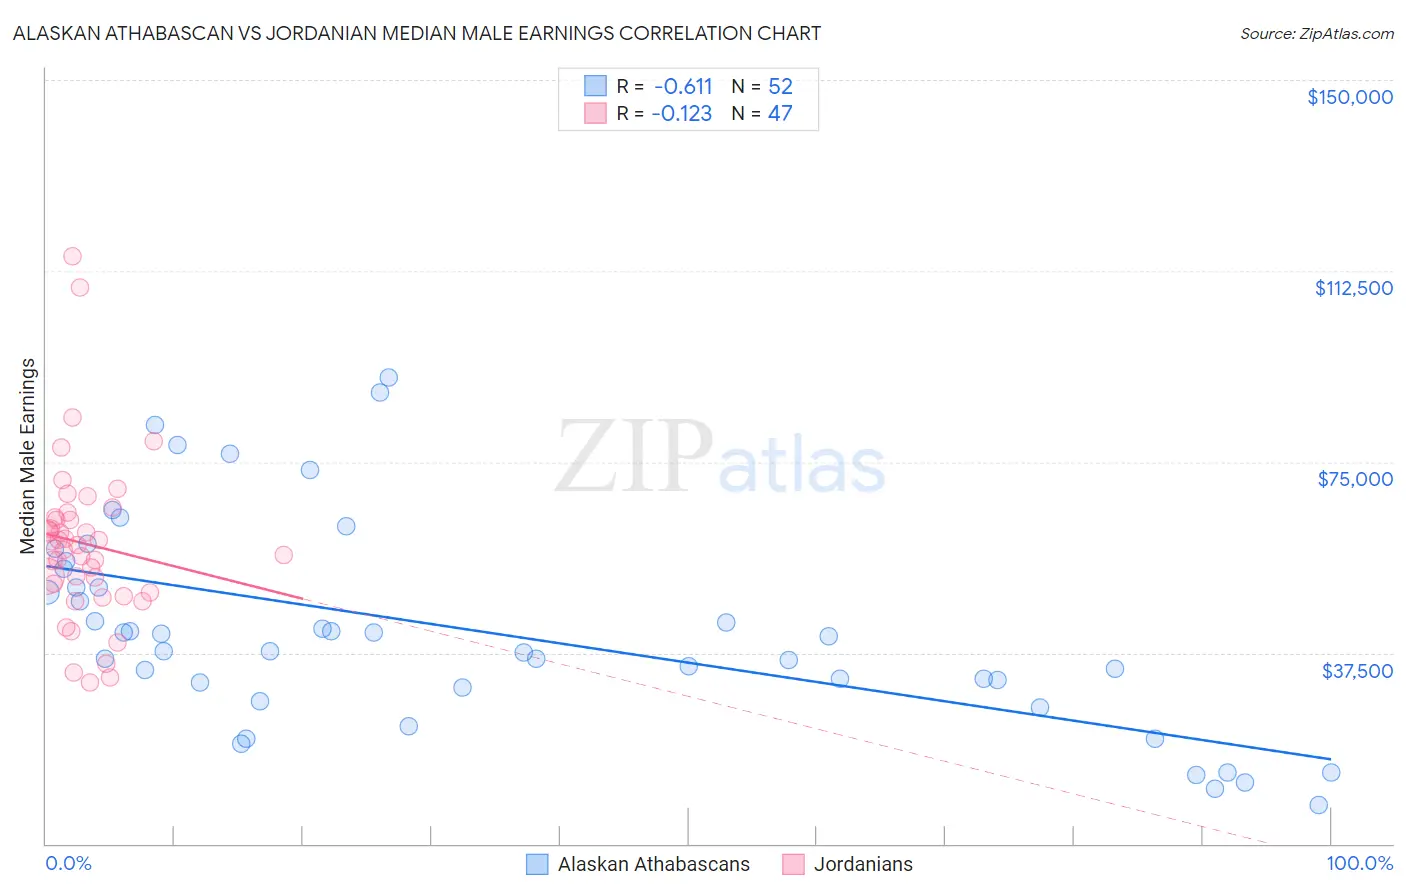
Alaskan Athabascan vs Jordanian Median Male Earnings Correlation Chart
The statistical analysis conducted on geographies consisting of 45,804,380 people shows a significant negative correlation between the proportion of Alaskan Athabascans and median male earnings in the United States with a correlation coefficient (R) of -0.611 and weighted average of $49,748. Similarly, the statistical analysis conducted on geographies consisting of 166,398,060 people shows a poor negative correlation between the proportion of Jordanians and median male earnings in the United States with a correlation coefficient (R) of -0.123 and weighted average of $58,500, a difference of 17.6%.
Median Male Earnings Correlation Summary
| Measurement | Alaskan Athabascan | Jordanian |
| Minimum | $7,708 | $31,660 |
| Maximum | $91,667 | $115,416 |
| Range | $83,959 | $83,756 |
| Mean | $41,933 | $58,929 |
| Median | $39,323 | $58,675 |
| Interquartile 25% (IQ1) | $31,226 | $49,250 |
| Interquartile 75% (IQ3) | $52,255 | $63,996 |
| Interquartile Range (IQR) | $21,029 | $14,746 |
| Standard Deviation (Sample) | $20,193 | $16,248 |
| Standard Deviation (Population) | $19,997 | $16,074 |
Similar Demographics by Median Male Earnings
Demographics Similar to Alaskan Athabascans by Median Male Earnings
In terms of median male earnings, the demographic groups most similar to Alaskan Athabascans are Senegalese ($49,774, a difference of 0.050%), Alaska Native ($49,711, a difference of 0.070%), British West Indian ($49,636, a difference of 0.23%), German Russian ($49,924, a difference of 0.35%), and Cree ($49,497, a difference of 0.51%).
| Demographics | Rating | Rank | Median Male Earnings |
| Immigrants | Guyana | 1.6 /100 | #248 | Tragic $50,321 |
| Immigrants | Burma/Myanmar | 1.6 /100 | #249 | Tragic $50,298 |
| Osage | 1.6 /100 | #250 | Tragic $50,292 |
| Immigrants | Grenada | 1.6 /100 | #251 | Tragic $50,279 |
| Immigrants | Cabo Verde | 1.2 /100 | #252 | Tragic $50,009 |
| German Russians | 1.1 /100 | #253 | Tragic $49,924 |
| Senegalese | 1.0 /100 | #254 | Tragic $49,774 |
| Alaskan Athabascans | 0.9 /100 | #255 | Tragic $49,748 |
| Alaska Natives | 0.9 /100 | #256 | Tragic $49,711 |
| British West Indians | 0.8 /100 | #257 | Tragic $49,636 |
| Cree | 0.7 /100 | #258 | Tragic $49,497 |
| Nepalese | 0.7 /100 | #259 | Tragic $49,458 |
| Iroquois | 0.7 /100 | #260 | Tragic $49,374 |
| Liberians | 0.6 /100 | #261 | Tragic $49,318 |
| Immigrants | West Indies | 0.6 /100 | #262 | Tragic $49,271 |
Demographics Similar to Jordanians by Median Male Earnings
In terms of median male earnings, the demographic groups most similar to Jordanians are Immigrants from Poland ($58,452, a difference of 0.080%), Assyrian/Chaldean/Syriac ($58,437, a difference of 0.11%), Northern European ($58,588, a difference of 0.15%), Immigrants from Brazil ($58,324, a difference of 0.30%), and Albanian ($58,680, a difference of 0.31%).
| Demographics | Rating | Rank | Median Male Earnings |
| Laotians | 99.2 /100 | #91 | Exceptional $59,351 |
| Immigrants | Kazakhstan | 99.1 /100 | #92 | Exceptional $59,278 |
| Immigrants | Southern Europe | 99.0 /100 | #93 | Exceptional $59,217 |
| Immigrants | North Macedonia | 99.0 /100 | #94 | Exceptional $59,189 |
| Immigrants | Lebanon | 98.6 /100 | #95 | Exceptional $58,835 |
| Albanians | 98.4 /100 | #96 | Exceptional $58,680 |
| Northern Europeans | 98.2 /100 | #97 | Exceptional $58,588 |
| Jordanians | 98.1 /100 | #98 | Exceptional $58,500 |
| Immigrants | Poland | 98.0 /100 | #99 | Exceptional $58,452 |
| Assyrians/Chaldeans/Syriacs | 97.9 /100 | #100 | Exceptional $58,437 |
| Immigrants | Brazil | 97.7 /100 | #101 | Exceptional $58,324 |
| Syrians | 97.4 /100 | #102 | Exceptional $58,187 |
| Poles | 97.3 /100 | #103 | Exceptional $58,139 |
| Armenians | 97.3 /100 | #104 | Exceptional $58,134 |
| Immigrants | Western Asia | 97.3 /100 | #105 | Exceptional $58,131 |