Bermudan vs Immigrants from Sierra Leone Median Male Earnings
COMPARE
Bermudan
Immigrants from Sierra Leone
Median Male Earnings
Median Male Earnings Comparison
Bermudans
Immigrants from Sierra Leone
$52,465
MEDIAN MALE EARNINGS
12.1/ 100
METRIC RATING
209th/ 347
METRIC RANK
$53,905
MEDIAN MALE EARNINGS
36.0/ 100
METRIC RATING
185th/ 347
METRIC RANK
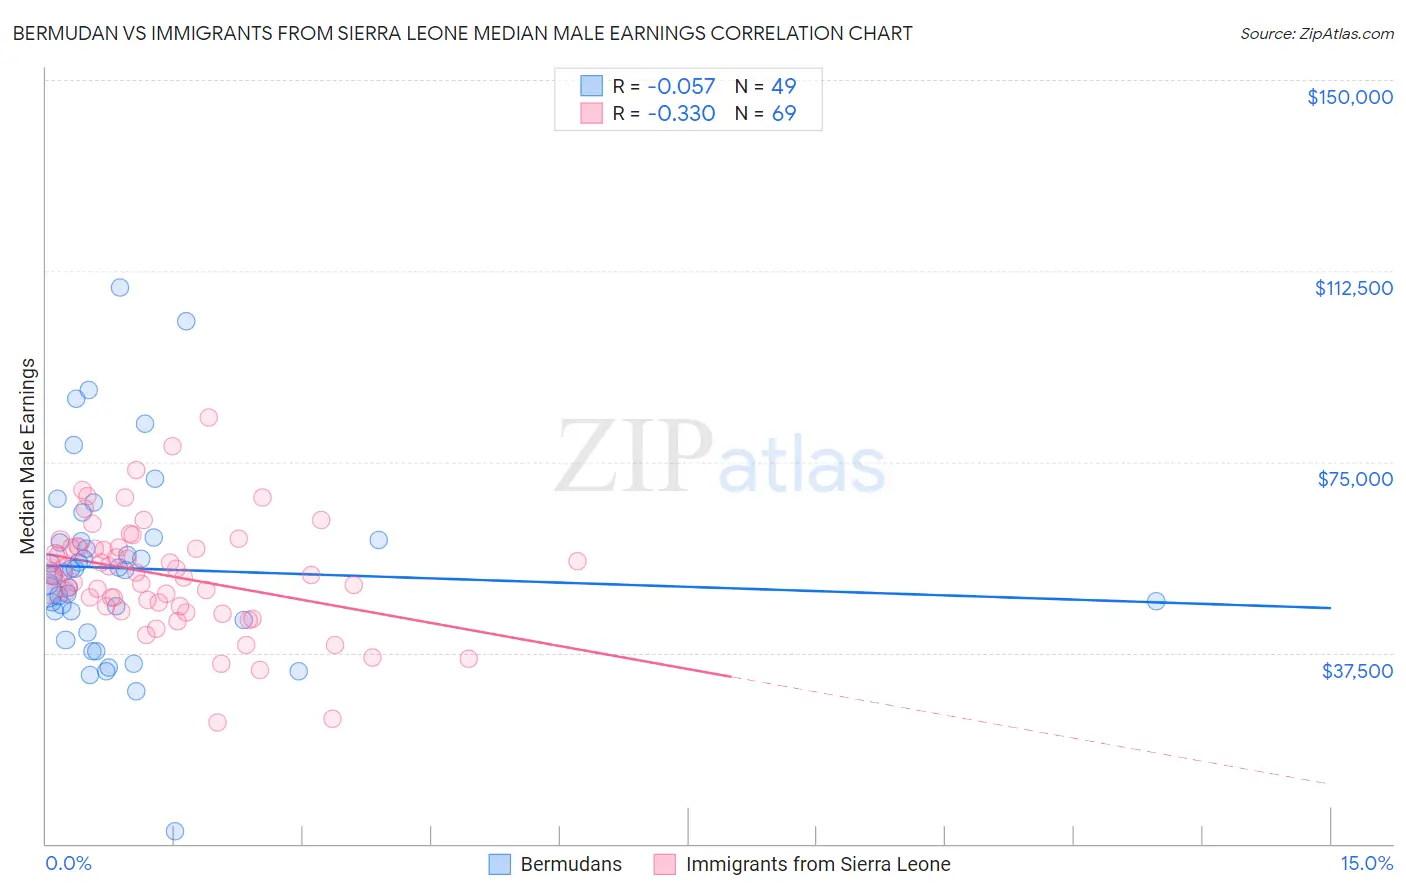
Bermudan vs Immigrants from Sierra Leone Median Male Earnings Correlation Chart
The statistical analysis conducted on geographies consisting of 55,727,224 people shows a slight negative correlation between the proportion of Bermudans and median male earnings in the United States with a correlation coefficient (R) of -0.057 and weighted average of $52,465. Similarly, the statistical analysis conducted on geographies consisting of 101,648,360 people shows a mild negative correlation between the proportion of Immigrants from Sierra Leone and median male earnings in the United States with a correlation coefficient (R) of -0.330 and weighted average of $53,905, a difference of 2.7%.
Median Male Earnings Correlation Summary
| Measurement | Bermudan | Immigrants from Sierra Leone |
| Minimum | $2,499 | $23,693 |
| Maximum | $109,250 | $83,830 |
| Range | $106,751 | $60,137 |
| Mean | $54,094 | $52,734 |
| Median | $53,290 | $52,856 |
| Interquartile 25% (IQ1) | $44,820 | $46,657 |
| Interquartile 75% (IQ3) | $59,519 | $58,267 |
| Interquartile Range (IQR) | $14,700 | $11,610 |
| Standard Deviation (Sample) | $18,662 | $10,929 |
| Standard Deviation (Population) | $18,471 | $10,849 |
Similar Demographics by Median Male Earnings
Demographics Similar to Bermudans by Median Male Earnings
In terms of median male earnings, the demographic groups most similar to Bermudans are Venezuelan ($52,510, a difference of 0.090%), Delaware ($52,412, a difference of 0.10%), Vietnamese ($52,525, a difference of 0.11%), Tlingit-Haida ($52,409, a difference of 0.11%), and Cajun ($52,325, a difference of 0.27%).
| Demographics | Rating | Rank | Median Male Earnings |
| Immigrants | Uruguay | 16.8 /100 | #202 | Poor $52,860 |
| Panamanians | 16.5 /100 | #203 | Poor $52,835 |
| Ghanaians | 16.1 /100 | #204 | Poor $52,810 |
| Immigrants | Colombia | 15.0 /100 | #205 | Poor $52,725 |
| Immigrants | Iraq | 14.5 /100 | #206 | Poor $52,681 |
| Vietnamese | 12.7 /100 | #207 | Poor $52,525 |
| Venezuelans | 12.5 /100 | #208 | Poor $52,510 |
| Bermudans | 12.1 /100 | #209 | Poor $52,465 |
| Delaware | 11.5 /100 | #210 | Poor $52,412 |
| Tlingit-Haida | 11.5 /100 | #211 | Poor $52,409 |
| Cajuns | 10.7 /100 | #212 | Poor $52,325 |
| Native Hawaiians | 10.5 /100 | #213 | Poor $52,306 |
| Immigrants | Nonimmigrants | 9.3 /100 | #214 | Tragic $52,170 |
| Immigrants | Cameroon | 8.9 /100 | #215 | Tragic $52,119 |
| Immigrants | Venezuela | 8.3 /100 | #216 | Tragic $52,041 |
Demographics Similar to Immigrants from Sierra Leone by Median Male Earnings
In terms of median male earnings, the demographic groups most similar to Immigrants from Sierra Leone are White/Caucasian ($53,925, a difference of 0.040%), Yugoslavian ($53,967, a difference of 0.11%), Immigrants from South America ($53,962, a difference of 0.11%), Colombian ($53,832, a difference of 0.14%), and Immigrants from Eritrea ($53,715, a difference of 0.35%).
| Demographics | Rating | Rank | Median Male Earnings |
| Sierra Leoneans | 44.8 /100 | #178 | Average $54,279 |
| Celtics | 43.9 /100 | #179 | Average $54,242 |
| Iraqis | 42.5 /100 | #180 | Average $54,182 |
| Immigrants | Immigrants | 42.1 /100 | #181 | Average $54,168 |
| Yugoslavians | 37.4 /100 | #182 | Fair $53,967 |
| Immigrants | South America | 37.3 /100 | #183 | Fair $53,962 |
| Whites/Caucasians | 36.5 /100 | #184 | Fair $53,925 |
| Immigrants | Sierra Leone | 36.0 /100 | #185 | Fair $53,905 |
| Colombians | 34.4 /100 | #186 | Fair $53,832 |
| Immigrants | Eritrea | 31.8 /100 | #187 | Fair $53,715 |
| Immigrants | Eastern Africa | 31.8 /100 | #188 | Fair $53,713 |
| Puget Sound Salish | 31.6 /100 | #189 | Fair $53,704 |
| Uruguayans | 31.1 /100 | #190 | Fair $53,680 |
| Guamanians/Chamorros | 30.7 /100 | #191 | Fair $53,661 |
| Scotch-Irish | 30.6 /100 | #192 | Fair $53,658 |