Alaskan Athabascan vs Immigrants from Eastern Asia Disability Age 65 to 74

COMPARE

Alaskan Athabascan
Race
Ancestry
AfghanAfricanAlaska NativeAlaskan AthabascanAlbanianAleutAlsatianAmericanApacheArabArapahoArgentineanArmenianAssyrian/Chaldean/SyriacAustralianAustrianBahamianBangladeshiBarbadianBasqueBelgianBelizeanBermudanBhutaneseBlackfeetBolivianBrazilianBritishBritish West IndianBulgarianBurmeseCajunCambodianCanadianCape VerdeanCarpatho RusynCelticCentral AmericanCentral American IndianCherokeeCheyenneChickasawChileanChineseChippewaChoctawColombianColvilleComancheCosta RicanCreeCreekCroatianCrowCubanCypriotCzechCzechoslovakianDanishDelawareDominicanDutchDutch West IndianEastern EuropeanEcuadorianEgyptianEnglishEstonianEthiopianEuropeanFijianFilipinoFinnishFrenchFrench American IndianFrench CanadianGermanGerman RussianGhanaianGreekGuamanian/ChamorroGuatemalanGuyaneseHaitianHmongHonduranHopiHoumaHungarianIcelanderIndian (Asian)IndonesianInupiatIranianIraqiIrishIroquoisIsraeliItalianJamaicanJapaneseJordanianKenyanKiowaKoreanLaotianLatvianLebaneseLiberianLithuanianLumbeeLuxembourgerMacedonianMalaysianMalteseMarshalleseMenomineeMexicanMexican American IndianMongolianMoroccanNative HawaiianNavajoNepaleseNew ZealanderNicaraguanNigerianNorthern EuropeanNorwegianOkinawanOsageOttawaPaiutePakistaniPalestinianPanamanianParaguayanPennsylvania GermanPeruvianPimaPolishPortuguesePotawatomiPuebloPuerto RicanPuget Sound SalishRomanianRussianSalvadoranSamoanScandinavianScotch-IrishScottishSeminoleSenegaleseSerbianShoshoneSierra LeoneanSiouxSlavicSlovakSloveneSomaliSouth AfricanSouth AmericanSouth American IndianSoviet UnionSpaniardSpanishSpanish AmericanSpanish American IndianSri LankanSubsaharan AfricanSudaneseSwedishSwissSyrianTaiwaneseThaiTlingit-HaidaTohono O'OdhamTonganTrinidadian and TobagonianTsimshianTurkishU.S. Virgin IslanderUgandanUkrainianUruguayanUteVenezuelanVietnameseWelshWest IndianYakamaYaquiYugoslavianYumanYup'ikZimbabwean
Immigration
NonimmigrantsImmigrantsAfghanistanAfricaAlbaniaArgentinaArmeniaAsiaAustraliaAustriaBahamasBangladeshBarbadosBelarusBelgiumBelizeBoliviaBosnia and HerzegovinaBrazilBulgariaBurma/MyanmarCabo VerdeCambodiaCameroonCanadaCaribbeanCentral AmericaChileChinaColombiaCongoCosta RicaCroatiaCubaCzechoslovakiaDenmarkDominicaDominican RepublicEastern AfricaEastern EuropeEcuadorEgyptEl SalvadorEnglandEritreaEthiopiaEuropeFijiFranceGermanyGhanaGreeceGrenadaGuatemalaGuyanaHaitiHondurasHong KongHungaryIndiaIndonesiaIranIraqIrelandIsraelItalyJamaicaJapanJordanKazakhstanKenyaKoreaKuwaitLaosLatin AmericaLatviaLebanonLiberiaLithuaniaMalaysiaMexicoMicronesiaMiddle AfricaMoldovaMoroccoNepalNetherlandsNicaraguaNigeriaNorth AmericaNorth MacedoniaNorthern AfricaNorthern EuropeNorwayOceaniaPakistanPanamaPeruPhilippinesPolandPortugalRomaniaRussiaSaudi ArabiaScotlandSenegalSerbiaSierra LeoneSingaporeSomaliaSouth AfricaSouth AmericaSouth Central AsiaSouth Eastern AsiaSouthern EuropeSpainSri LankaSt. Vincent and the GrenadinesSudanSwedenSwitzerlandSyriaTaiwanThailandTrinidad and TobagoTurkeyUgandaUkraineUruguayUzbekistanVenezuelaVietnamWest IndiesWestern AfricaWestern AsiaWestern EuropeYemenZaireZimbabweAzores
Immigrants from Eastern Asia
Race
Ancestry
AfghanAfricanAlaska NativeAlbanianAleutAlsatianAmericanApacheArabArapahoArgentineanArmenianAssyrian/Chaldean/SyriacAustralianAustrianBahamianBangladeshiBarbadianBasqueBelgianBelizeanBermudanBhutaneseBlackfeetBolivianBrazilianBritishBritish West IndianBulgarianBurmeseCajunCambodianCanadianCape VerdeanCarpatho RusynCelticCentral AmericanCentral American IndianCherokeeCheyenneChickasawChileanChineseChippewaChoctawColombianColvilleComancheCosta RicanCreeCreekCroatianCrowCubanCypriotCzechCzechoslovakianDanishDelawareDominicanDutchDutch West IndianEastern EuropeanEcuadorianEgyptianEnglishEstonianEthiopianEuropeanFijianFilipinoFinnishFrenchFrench American IndianFrench CanadianGermanGerman RussianGhanaianGreekGuamanian/ChamorroGuatemalanGuyaneseHaitianHmongHonduranHopiHoumaHungarianIcelanderIndian (Asian)IndonesianInupiatIranianIraqiIrishIroquoisIsraeliItalianJamaicanJapaneseJordanianKenyanKiowaKoreanLaotianLatvianLebaneseLiberianLithuanianLumbeeLuxembourgerMacedonianMalaysianMalteseMarshalleseMenomineeMexicanMexican American IndianMongolianMoroccanNative HawaiianNavajoNepaleseNew ZealanderNicaraguanNigerianNorthern EuropeanNorwegianOkinawanOsageOttawaPaiutePakistaniPalestinianPanamanianParaguayanPennsylvania GermanPeruvianPimaPolishPortuguesePotawatomiPuebloPuerto RicanPuget Sound SalishRomanianRussianSalvadoranSamoanScandinavianScotch-IrishScottishSeminoleSenegaleseSerbianShoshoneSierra LeoneanSiouxSlavicSlovakSloveneSomaliSouth AfricanSouth AmericanSouth American IndianSoviet UnionSpaniardSpanishSpanish AmericanSpanish American IndianSri LankanSubsaharan AfricanSudaneseSwedishSwissSyrianTaiwaneseThaiTlingit-HaidaTohono O'OdhamTonganTrinidadian and TobagonianTsimshianTurkishU.S. Virgin IslanderUgandanUkrainianUruguayanUteVenezuelanVietnameseWelshWest IndianYakamaYaquiYugoslavianYumanYup'ikZimbabwean
Immigration
NonimmigrantsImmigrantsAfghanistanAfricaAlbaniaArgentinaArmeniaAsiaAustraliaAustriaBahamasBangladeshBarbadosBelarusBelgiumBelizeBoliviaBosnia and HerzegovinaBrazilBulgariaBurma/MyanmarCabo VerdeCambodiaCameroonCanadaCaribbeanCentral AmericaChileChinaColombiaCongoCosta RicaCroatiaCubaCzechoslovakiaDenmarkDominicaDominican RepublicEastern AfricaEastern AsiaEastern EuropeEcuadorEgyptEl SalvadorEnglandEritreaEthiopiaEuropeFijiFranceGermanyGhanaGreeceGrenadaGuatemalaGuyanaHaitiHondurasHong KongHungaryIndiaIndonesiaIranIraqIrelandIsraelItalyJamaicaJapanJordanKazakhstanKenyaKoreaKuwaitLaosLatin AmericaLatviaLebanonLiberiaLithuaniaMalaysiaMexicoMicronesiaMiddle AfricaMoldovaMoroccoNepalNetherlandsNicaraguaNigeriaNorth AmericaNorth MacedoniaNorthern AfricaNorthern EuropeNorwayOceaniaPakistanPanamaPeruPhilippinesPolandPortugalRomaniaRussiaSaudi ArabiaScotlandSenegalSerbiaSierra LeoneSingaporeSomaliaSouth AfricaSouth AmericaSouth Central AsiaSouth Eastern AsiaSouthern EuropeSpainSri LankaSt. Vincent and the GrenadinesSudanSwedenSwitzerlandSyriaTaiwanThailandTrinidad and TobagoTurkeyUgandaUkraineUruguayUzbekistanVenezuelaVietnamWest IndiesWestern AfricaWestern AsiaWestern EuropeYemenZaireZimbabweAzores
Disability Age 65 to 74
Income
Poverty
Unemployment
Labor Participation
Family Structure
Vehicle Availability
Education Level
Disability

Disability Age 65 to 74 Comparison

Alaskan Athabascans

Immigrants from Eastern Asia

Tragic
Exceptional
32.4%
DISABILITY AGE 65 TO 74
0.0/ 100
METRIC RATING
338th/ 347
METRIC RANK
20.3%
DISABILITY AGE 65 TO 74
100.0/ 100
METRIC RATING
10th/ 347
METRIC RANK

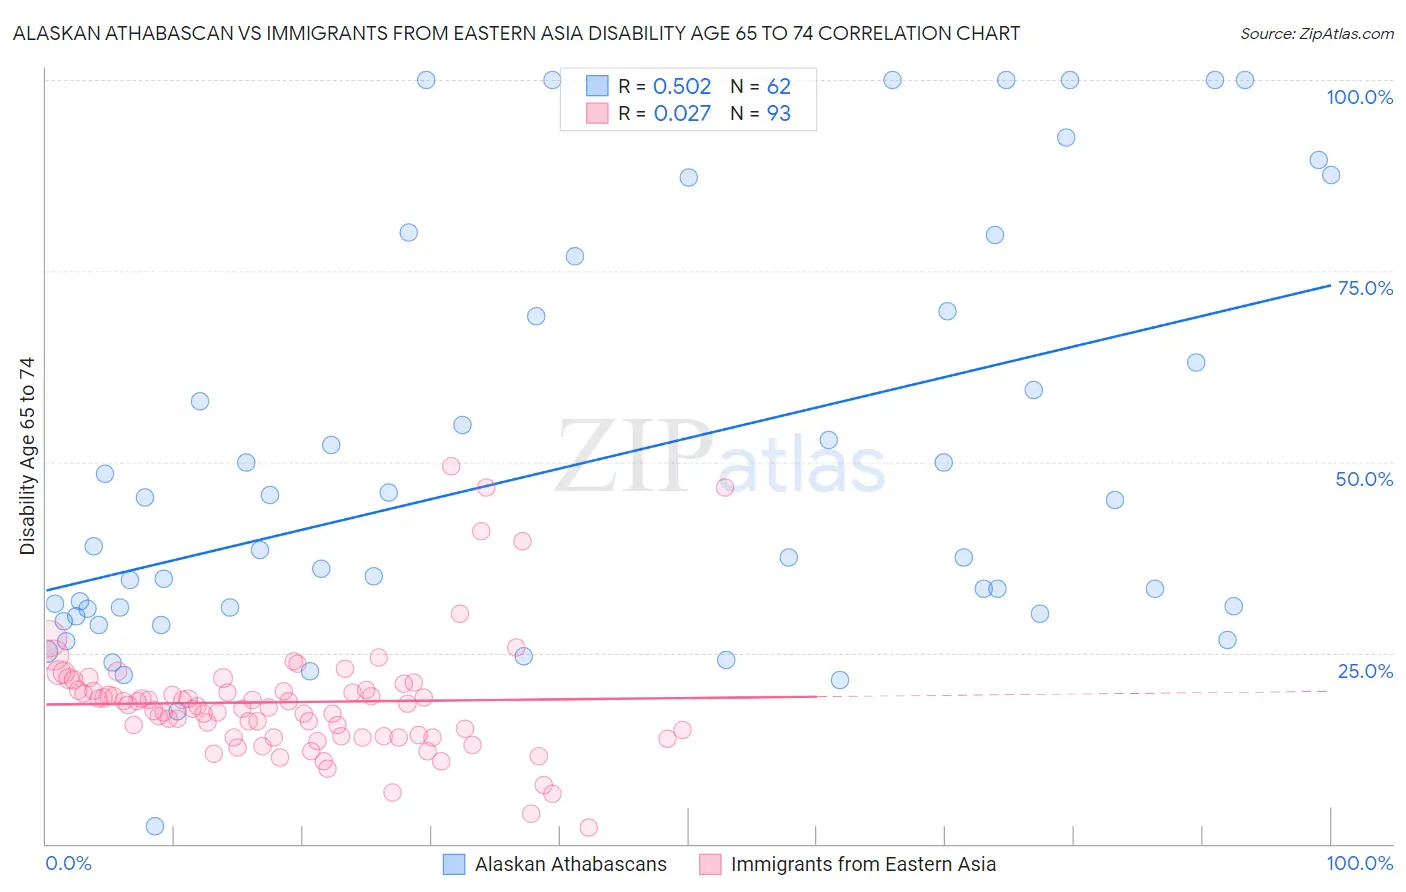
Alaskan Athabascan vs Immigrants from Eastern Asia Disability Age 65 to 74 Correlation Chart

The statistical analysis conducted on geographies consisting of 45,797,821 people shows a substantial positive correlation between the proportion of Alaskan Athabascans and percentage of population with a disability between the ages 65 and 75 in the United States with a correlation coefficient (R) of 0.502 and weighted average of 32.4%. Similarly, the statistical analysis conducted on geographies consisting of 498,306,983 people shows no correlation between the proportion of Immigrants from Eastern Asia and percentage of population with a disability between the ages 65 and 75 in the United States with a correlation coefficient (R) of 0.027 and weighted average of 20.3%, a difference of 59.5%.
Alaskan Athabascan vs Immigrants from Eastern Asia Disability Age 65 to 74

Disability Age 65 to 74 Correlation Summary

MeasurementAlaskan AthabascanImmigrants from Eastern Asia
Minimum2.3%2.2%
Maximum100.0%49.4%
Range97.7%47.2%
Mean49.4%18.6%
Median38.0%18.0%
Interquartile 25% (IQ1)30.1%14.0%
Interquartile 75% (IQ3)69.1%20.2%
Interquartile Range (IQR)39.0%6.1%
Standard Deviation (Sample)26.6%7.9%
Standard Deviation (Population)26.4%7.8%

Similar Demographics by Disability Age 65 to 74

Demographics Similar to Alaskan Athabascans by Disability Age 65 to 74

In terms of disability age 65 to 74, the demographic groups most similar to Alaskan Athabascans are Houma (32.3%, a difference of 0.19%), Kiowa (32.6%, a difference of 0.62%), Lumbee (32.7%, a difference of 1.1%), Tsimshian (32.9%, a difference of 1.7%), and Pueblo (33.1%, a difference of 2.3%).
DemographicsRating | RankDisability Age 65 to 74
Chickasaw
0.0
/100
|
#331
Tragic
30.2%
Natives/Alaskans
0.0
/100
|
#332
Tragic
30.4%
Colville
0.0
/100
|
#333
Tragic
30.5%
Alaska Natives
0.0
/100
|
#334
Tragic
30.6%
Cheyenne
0.0
/100
|
#335
Tragic
31.1%
Yuman
0.0
/100
|
#336
Tragic
31.5%
Houma
0.0
/100
|
#337
Tragic
32.3%
Alaskan Athabascans
0.0
/100
|
#338
Tragic
32.4%
Kiowa
0.0
/100
|
#339
Tragic
32.6%
Lumbee
0.0
/100
|
#340
Tragic
32.7%
Tsimshian
0.0
/100
|
#341
Tragic
32.9%
Pueblo
0.0
/100
|
#342
Tragic
33.1%
Navajo
0.0
/100
|
#343
Tragic
33.3%
Inupiat
0.0
/100
|
#344
Tragic
34.5%
Tohono O'odham
0.0
/100
|
#345
Tragic
36.0%

Demographics Similar to Immigrants from Eastern Asia by Disability Age 65 to 74

In terms of disability age 65 to 74, the demographic groups most similar to Immigrants from Eastern Asia are Immigrants from China (20.3%, a difference of 0.070%), Immigrants from Ireland (20.3%, a difference of 0.16%), Immigrants from Korea (20.4%, a difference of 0.37%), Immigrants from Singapore (20.4%, a difference of 0.76%), and Thai (20.1%, a difference of 1.0%).
DemographicsRating | RankDisability Age 65 to 74
Immigrants | India
100.0
/100
|
#3
Exceptional
19.7%
Immigrants | Hong Kong
100.0
/100
|
#4
Exceptional
19.9%
Immigrants | Israel
100.0
/100
|
#5
Exceptional
19.9%
Iranians
100.0
/100
|
#6
Exceptional
19.9%
Cypriots
100.0
/100
|
#7
Exceptional
20.1%
Thais
100.0
/100
|
#8
Exceptional
20.1%
Immigrants | China
100.0
/100
|
#9
Exceptional
20.3%
Immigrants | Eastern Asia
100.0
/100
|
#10
Exceptional
20.3%
Immigrants | Ireland
100.0
/100
|
#11
Exceptional
20.3%
Immigrants | Korea
100.0
/100
|
#12
Exceptional
20.4%
Immigrants | Singapore
100.0
/100
|
#13
Exceptional
20.4%
Indians (Asian)
100.0
/100
|
#14
Exceptional
20.5%
Paraguayans
100.0
/100
|
#15
Exceptional
20.5%
Immigrants | Lithuania
100.0
/100
|
#16
Exceptional
20.5%
Immigrants | South Central Asia
100.0
/100
|
#17
Exceptional
20.6%