Alaskan Athabascan vs Immigrants from Eastern Asia Kindergarten
COMPARE
Alaskan Athabascan
Immigrants from Eastern Asia
Kindergarten
Kindergarten Comparison
Alaskan Athabascans
Immigrants from Eastern Asia
98.8%
KINDERGARTEN
100.0/ 100
METRIC RATING
6th/ 347
METRIC RANK
97.6%
KINDERGARTEN
1.7/ 100
METRIC RATING
238th/ 347
METRIC RANK
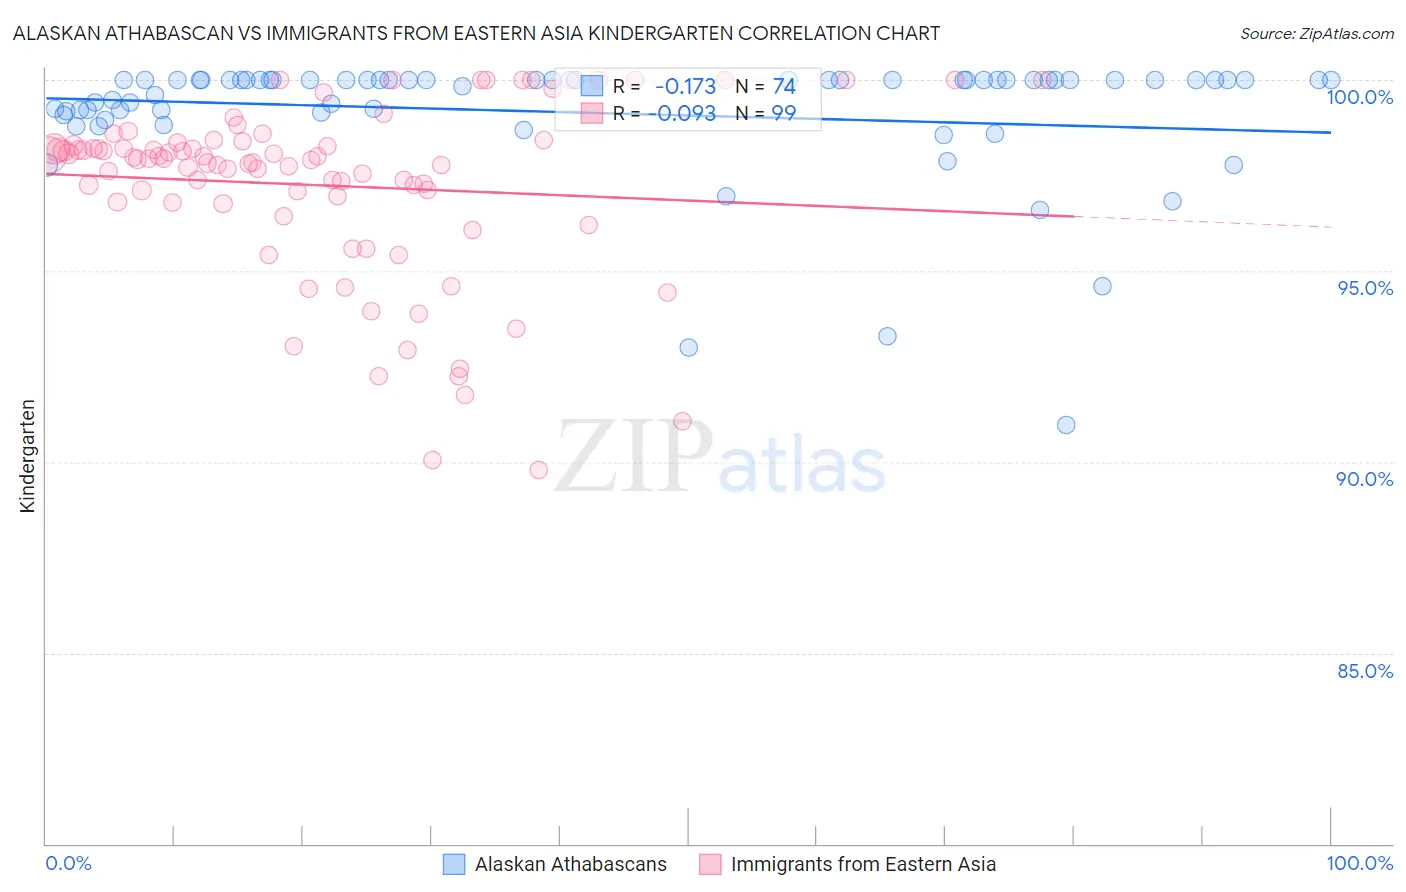
Alaskan Athabascan vs Immigrants from Eastern Asia Kindergarten Correlation Chart
The statistical analysis conducted on geographies consisting of 45,820,365 people shows a poor negative correlation between the proportion of Alaskan Athabascans and percentage of population with at least kindergarten education in the United States with a correlation coefficient (R) of -0.173 and weighted average of 98.8%. Similarly, the statistical analysis conducted on geographies consisting of 499,865,893 people shows a slight negative correlation between the proportion of Immigrants from Eastern Asia and percentage of population with at least kindergarten education in the United States with a correlation coefficient (R) of -0.093 and weighted average of 97.6%, a difference of 1.2%.
Kindergarten Correlation Summary
| Measurement | Alaskan Athabascan | Immigrants from Eastern Asia |
| Minimum | 91.0% | 89.8% |
| Maximum | 100.0% | 100.0% |
| Range | 9.0% | 10.2% |
| Mean | 99.1% | 97.2% |
| Median | 100.0% | 97.9% |
| Interquartile 25% (IQ1) | 99.1% | 96.8% |
| Interquartile 75% (IQ3) | 100.0% | 98.4% |
| Interquartile Range (IQR) | 0.87% | 1.6% |
| Standard Deviation (Sample) | 1.7% | 2.3% |
| Standard Deviation (Population) | 1.7% | 2.3% |
Similar Demographics by Kindergarten
Demographics Similar to Alaskan Athabascans by Kindergarten
In terms of kindergarten, the demographic groups most similar to Alaskan Athabascans are Alaska Native (98.7%, a difference of 0.040%), Norwegian (98.7%, a difference of 0.060%), Tsimshian (98.8%, a difference of 0.070%), Tlingit-Haida (98.7%, a difference of 0.080%), and Slovak (98.7%, a difference of 0.080%).
| Demographics | Rating | Rank | Kindergarten |
| Crow | 100.0 /100 | #1 | Exceptional 99.7% |
| Yup'ik | 100.0 /100 | #2 | Exceptional 99.2% |
| Inupiat | 100.0 /100 | #3 | Exceptional 98.9% |
| Welsh | 100.0 /100 | #4 | Exceptional 98.9% |
| Tsimshian | 100.0 /100 | #5 | Exceptional 98.8% |
| Alaskan Athabascans | 100.0 /100 | #6 | Exceptional 98.8% |
| Alaska Natives | 100.0 /100 | #7 | Exceptional 98.7% |
| Norwegians | 100.0 /100 | #8 | Exceptional 98.7% |
| Tlingit-Haida | 100.0 /100 | #9 | Exceptional 98.7% |
| Slovaks | 100.0 /100 | #10 | Exceptional 98.7% |
| Germans | 100.0 /100 | #11 | Exceptional 98.7% |
| Slovenes | 100.0 /100 | #12 | Exceptional 98.7% |
| Carpatho Rusyns | 100.0 /100 | #13 | Exceptional 98.7% |
| English | 100.0 /100 | #14 | Exceptional 98.7% |
| Swedes | 100.0 /100 | #15 | Exceptional 98.7% |
Demographics Similar to Immigrants from Eastern Asia by Kindergarten
In terms of kindergarten, the demographic groups most similar to Immigrants from Eastern Asia are Nigerian (97.6%, a difference of 0.0%), U.S. Virgin Islander (97.6%, a difference of 0.0%), Korean (97.6%, a difference of 0.010%), Immigrants from Pakistan (97.7%, a difference of 0.020%), and Immigrants from Malaysia (97.7%, a difference of 0.020%).
| Demographics | Rating | Rank | Kindergarten |
| Puerto Ricans | 2.7 /100 | #231 | Tragic 97.7% |
| Immigrants | Uruguay | 2.6 /100 | #232 | Tragic 97.7% |
| Immigrants | Pakistan | 2.2 /100 | #233 | Tragic 97.7% |
| Immigrants | Malaysia | 2.2 /100 | #234 | Tragic 97.7% |
| Colombians | 2.2 /100 | #235 | Tragic 97.7% |
| Immigrants | Western Asia | 2.1 /100 | #236 | Tragic 97.7% |
| Nigerians | 1.8 /100 | #237 | Tragic 97.6% |
| Immigrants | Eastern Asia | 1.7 /100 | #238 | Tragic 97.6% |
| U.S. Virgin Islanders | 1.7 /100 | #239 | Tragic 97.6% |
| Koreans | 1.6 /100 | #240 | Tragic 97.6% |
| Liberians | 1.3 /100 | #241 | Tragic 97.6% |
| Immigrants | Indonesia | 1.3 /100 | #242 | Tragic 97.6% |
| Asians | 1.2 /100 | #243 | Tragic 97.6% |
| Bolivians | 1.2 /100 | #244 | Tragic 97.6% |
| South Americans | 1.1 /100 | #245 | Tragic 97.6% |