Immigrants from Asia vs Immigrants from Eastern Asia Median Male Earnings
COMPARE
Immigrants from Asia
Immigrants from Eastern Asia
Median Male Earnings
Median Male Earnings Comparison
Immigrants from Asia
Immigrants from Eastern Asia
$63,240
MEDIAN MALE EARNINGS
100.0/ 100
METRIC RATING
35th/ 347
METRIC RANK
$66,903
MEDIAN MALE EARNINGS
100.0/ 100
METRIC RATING
15th/ 347
METRIC RANK
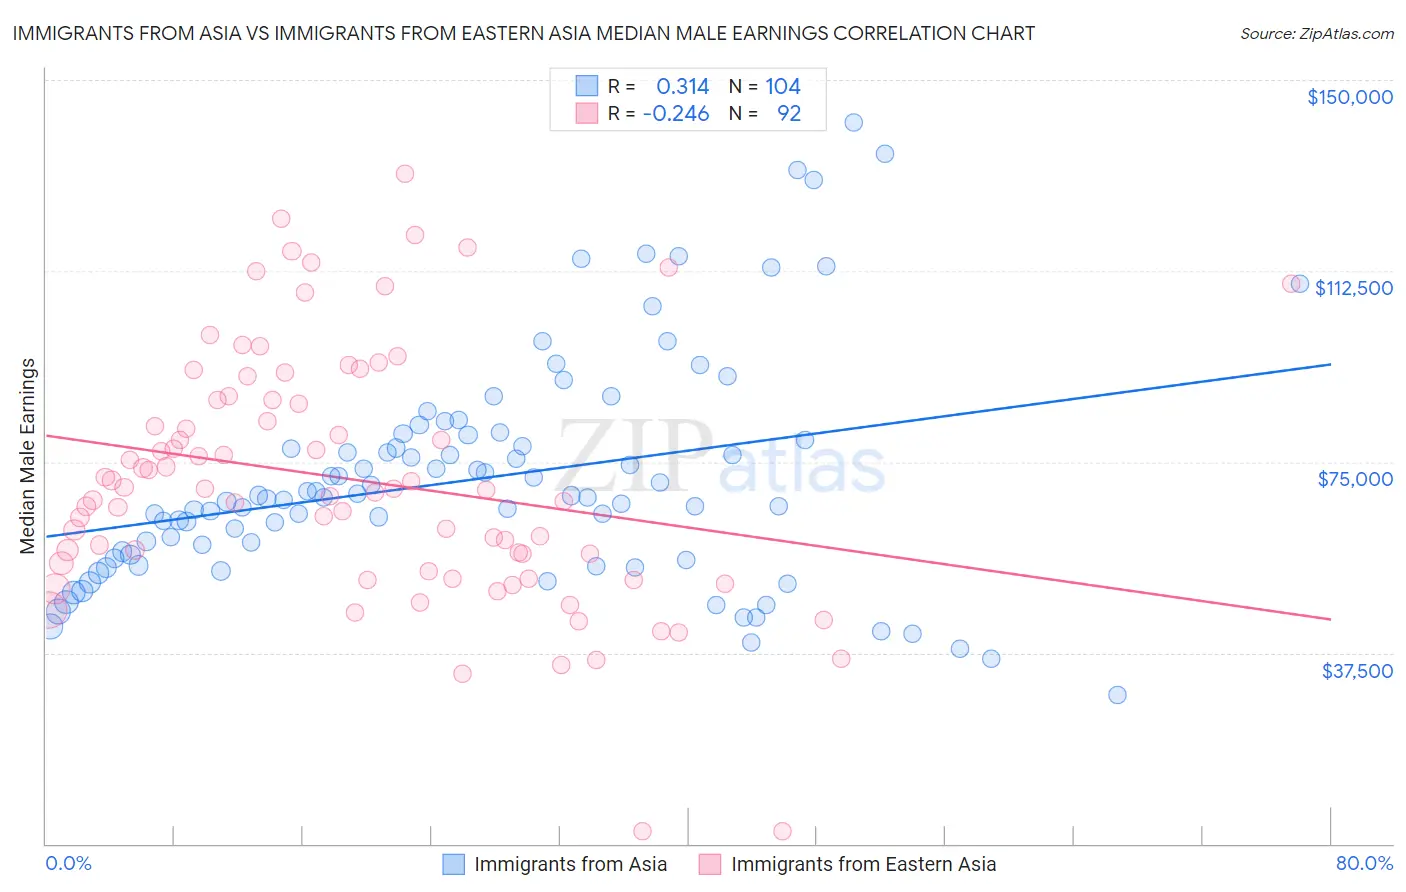
Immigrants from Asia vs Immigrants from Eastern Asia Median Male Earnings Correlation Chart
The statistical analysis conducted on geographies consisting of 548,524,419 people shows a mild positive correlation between the proportion of Immigrants from Asia and median male earnings in the United States with a correlation coefficient (R) of 0.314 and weighted average of $63,240. Similarly, the statistical analysis conducted on geographies consisting of 499,639,394 people shows a weak negative correlation between the proportion of Immigrants from Eastern Asia and median male earnings in the United States with a correlation coefficient (R) of -0.246 and weighted average of $66,903, a difference of 5.8%.
Median Male Earnings Correlation Summary
| Measurement | Immigrants from Asia | Immigrants from Eastern Asia |
| Minimum | $29,236 | $2,499 |
| Maximum | $141,758 | $131,653 |
| Range | $112,522 | $129,154 |
| Mean | $71,617 | $71,397 |
| Median | $67,918 | $69,591 |
| Interquartile 25% (IQ1) | $56,355 | $54,279 |
| Interquartile 75% (IQ3) | $79,747 | $87,124 |
| Interquartile Range (IQR) | $23,393 | $32,845 |
| Standard Deviation (Sample) | $22,311 | $24,831 |
| Standard Deviation (Population) | $22,203 | $24,695 |
Demographics Similar to Immigrants from Asia and Immigrants from Eastern Asia by Median Male Earnings
In terms of median male earnings, the demographic groups most similar to Immigrants from Asia are Immigrants from Russia ($63,326, a difference of 0.14%), Immigrants from Lithuania ($63,346, a difference of 0.17%), Soviet Union ($63,382, a difference of 0.22%), Latvian ($63,498, a difference of 0.41%), and Immigrants from France ($63,715, a difference of 0.75%). Similarly, the demographic groups most similar to Immigrants from Eastern Asia are Eastern European ($66,472, a difference of 0.65%), Immigrants from Belgium ($66,125, a difference of 1.2%), Indian (Asian) ($66,078, a difference of 1.3%), Cypriot ($65,549, a difference of 2.1%), and Immigrants from Japan ($65,518, a difference of 2.1%).
| Demographics | Rating | Rank | Median Male Earnings |
| Immigrants | Eastern Asia | 100.0 /100 | #15 | Exceptional $66,903 |
| Eastern Europeans | 100.0 /100 | #16 | Exceptional $66,472 |
| Immigrants | Belgium | 100.0 /100 | #17 | Exceptional $66,125 |
| Indians (Asian) | 100.0 /100 | #18 | Exceptional $66,078 |
| Cypriots | 100.0 /100 | #19 | Exceptional $65,549 |
| Immigrants | Japan | 100.0 /100 | #20 | Exceptional $65,518 |
| Immigrants | Sweden | 100.0 /100 | #21 | Exceptional $65,406 |
| Burmese | 100.0 /100 | #22 | Exceptional $65,236 |
| Immigrants | Korea | 100.0 /100 | #23 | Exceptional $65,079 |
| Immigrants | Northern Europe | 100.0 /100 | #24 | Exceptional $64,987 |
| Immigrants | Denmark | 100.0 /100 | #25 | Exceptional $64,625 |
| Turks | 100.0 /100 | #26 | Exceptional $64,253 |
| Immigrants | Switzerland | 100.0 /100 | #27 | Exceptional $63,944 |
| Russians | 100.0 /100 | #28 | Exceptional $63,939 |
| Asians | 100.0 /100 | #29 | Exceptional $63,827 |
| Immigrants | France | 100.0 /100 | #30 | Exceptional $63,715 |
| Latvians | 100.0 /100 | #31 | Exceptional $63,498 |
| Soviet Union | 100.0 /100 | #32 | Exceptional $63,382 |
| Immigrants | Lithuania | 100.0 /100 | #33 | Exceptional $63,346 |
| Immigrants | Russia | 100.0 /100 | #34 | Exceptional $63,326 |
| Immigrants | Asia | 100.0 /100 | #35 | Exceptional $63,240 |