Alaskan Athabascan vs Immigrants from Eastern Asia Male Poverty
COMPARE
Alaskan Athabascan
Immigrants from Eastern Asia
Male Poverty
Male Poverty Comparison
Alaskan Athabascans
Immigrants from Eastern Asia
12.8%
MALE POVERTY
0.3/ 100
METRIC RATING
243rd/ 347
METRIC RANK
10.4%
MALE POVERTY
95.3/ 100
METRIC RATING
86th/ 347
METRIC RANK
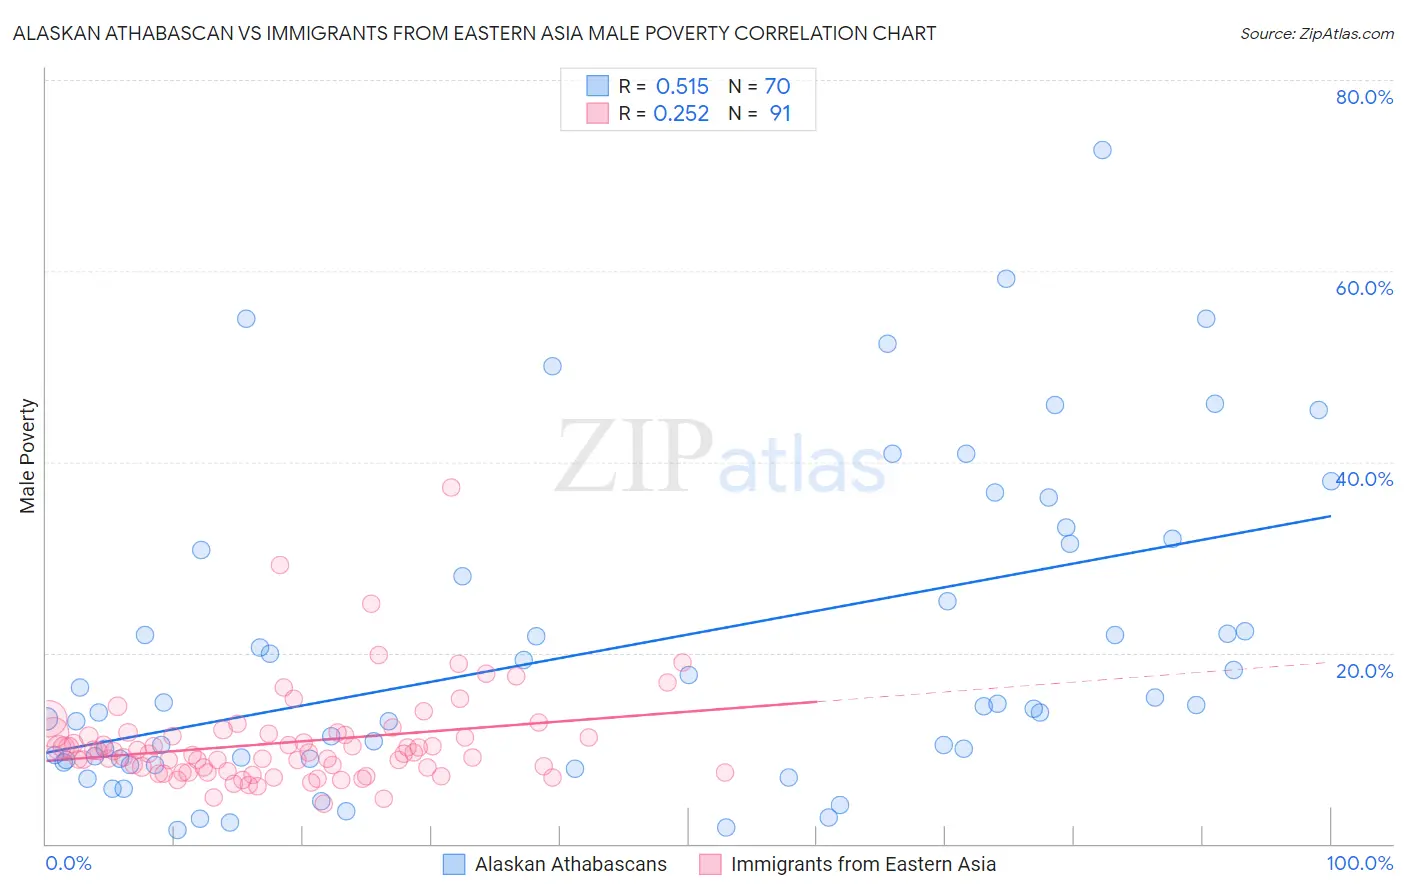
Alaskan Athabascan vs Immigrants from Eastern Asia Male Poverty Correlation Chart
The statistical analysis conducted on geographies consisting of 45,812,962 people shows a substantial positive correlation between the proportion of Alaskan Athabascans and poverty level among males in the United States with a correlation coefficient (R) of 0.515 and weighted average of 12.8%. Similarly, the statistical analysis conducted on geographies consisting of 498,983,535 people shows a weak positive correlation between the proportion of Immigrants from Eastern Asia and poverty level among males in the United States with a correlation coefficient (R) of 0.252 and weighted average of 10.4%, a difference of 23.4%.
Male Poverty Correlation Summary
| Measurement | Alaskan Athabascan | Immigrants from Eastern Asia |
| Minimum | 1.4% | 4.2% |
| Maximum | 72.7% | 37.3% |
| Range | 71.3% | 33.0% |
| Mean | 20.4% | 10.6% |
| Median | 14.5% | 9.5% |
| Interquartile 25% (IQ1) | 8.9% | 7.5% |
| Interquartile 75% (IQ3) | 30.8% | 11.6% |
| Interquartile Range (IQR) | 22.0% | 4.1% |
| Standard Deviation (Sample) | 16.4% | 5.0% |
| Standard Deviation (Population) | 16.2% | 5.0% |
Similar Demographics by Male Poverty
Demographics Similar to Alaskan Athabascans by Male Poverty
In terms of male poverty, the demographic groups most similar to Alaskan Athabascans are Nepalese (12.8%, a difference of 0.040%), Tsimshian (12.8%, a difference of 0.11%), Liberian (12.8%, a difference of 0.12%), Sudanese (12.8%, a difference of 0.20%), and Immigrants from El Salvador (12.8%, a difference of 0.42%).
| Demographics | Rating | Rank | Male Poverty |
| Immigrants | Saudi Arabia | 0.4 /100 | #236 | Tragic 12.7% |
| French American Indians | 0.4 /100 | #237 | Tragic 12.7% |
| Ecuadorians | 0.4 /100 | #238 | Tragic 12.7% |
| Ghanaians | 0.4 /100 | #239 | Tragic 12.7% |
| Immigrants | Middle Africa | 0.4 /100 | #240 | Tragic 12.7% |
| Sudanese | 0.3 /100 | #241 | Tragic 12.8% |
| Nepalese | 0.3 /100 | #242 | Tragic 12.8% |
| Alaskan Athabascans | 0.3 /100 | #243 | Tragic 12.8% |
| Tsimshian | 0.3 /100 | #244 | Tragic 12.8% |
| Liberians | 0.3 /100 | #245 | Tragic 12.8% |
| Immigrants | El Salvador | 0.2 /100 | #246 | Tragic 12.8% |
| Immigrants | Western Africa | 0.2 /100 | #247 | Tragic 12.9% |
| Immigrants | Sudan | 0.2 /100 | #248 | Tragic 12.9% |
| Potawatomi | 0.2 /100 | #249 | Tragic 12.9% |
| Immigrants | Nicaragua | 0.2 /100 | #250 | Tragic 12.9% |
Demographics Similar to Immigrants from Eastern Asia by Male Poverty
In terms of male poverty, the demographic groups most similar to Immigrants from Eastern Asia are Northern European (10.4%, a difference of 0.040%), Immigrants from England (10.4%, a difference of 0.13%), Czechoslovakian (10.3%, a difference of 0.18%), Cambodian (10.4%, a difference of 0.18%), and Immigrants from Denmark (10.4%, a difference of 0.18%).
| Demographics | Rating | Rank | Male Poverty |
| Immigrants | North America | 96.5 /100 | #79 | Exceptional 10.3% |
| English | 96.4 /100 | #80 | Exceptional 10.3% |
| Belgians | 95.9 /100 | #81 | Exceptional 10.3% |
| Egyptians | 95.9 /100 | #82 | Exceptional 10.3% |
| Immigrants | Sweden | 95.7 /100 | #83 | Exceptional 10.3% |
| Czechoslovakians | 95.6 /100 | #84 | Exceptional 10.3% |
| Immigrants | England | 95.5 /100 | #85 | Exceptional 10.4% |
| Immigrants | Eastern Asia | 95.3 /100 | #86 | Exceptional 10.4% |
| Northern Europeans | 95.2 /100 | #87 | Exceptional 10.4% |
| Cambodians | 95.0 /100 | #88 | Exceptional 10.4% |
| Immigrants | Denmark | 95.0 /100 | #89 | Exceptional 10.4% |
| Indians (Asian) | 94.9 /100 | #90 | Exceptional 10.4% |
| British | 94.8 /100 | #91 | Exceptional 10.4% |
| Jordanians | 94.4 /100 | #92 | Exceptional 10.4% |
| Australians | 94.4 /100 | #93 | Exceptional 10.4% |