Eastern European vs Immigrants from Bolivia Wage/Income Gap
COMPARE
Eastern European
Immigrants from Bolivia
Wage/Income Gap
Wage/Income Gap Comparison
Eastern Europeans
Immigrants from Bolivia
28.6%
WAGE/INCOME GAP
0.1/ 100
METRIC RATING
312th/ 347
METRIC RANK
26.0%
WAGE/INCOME GAP
36.4/ 100
METRIC RATING
181st/ 347
METRIC RANK
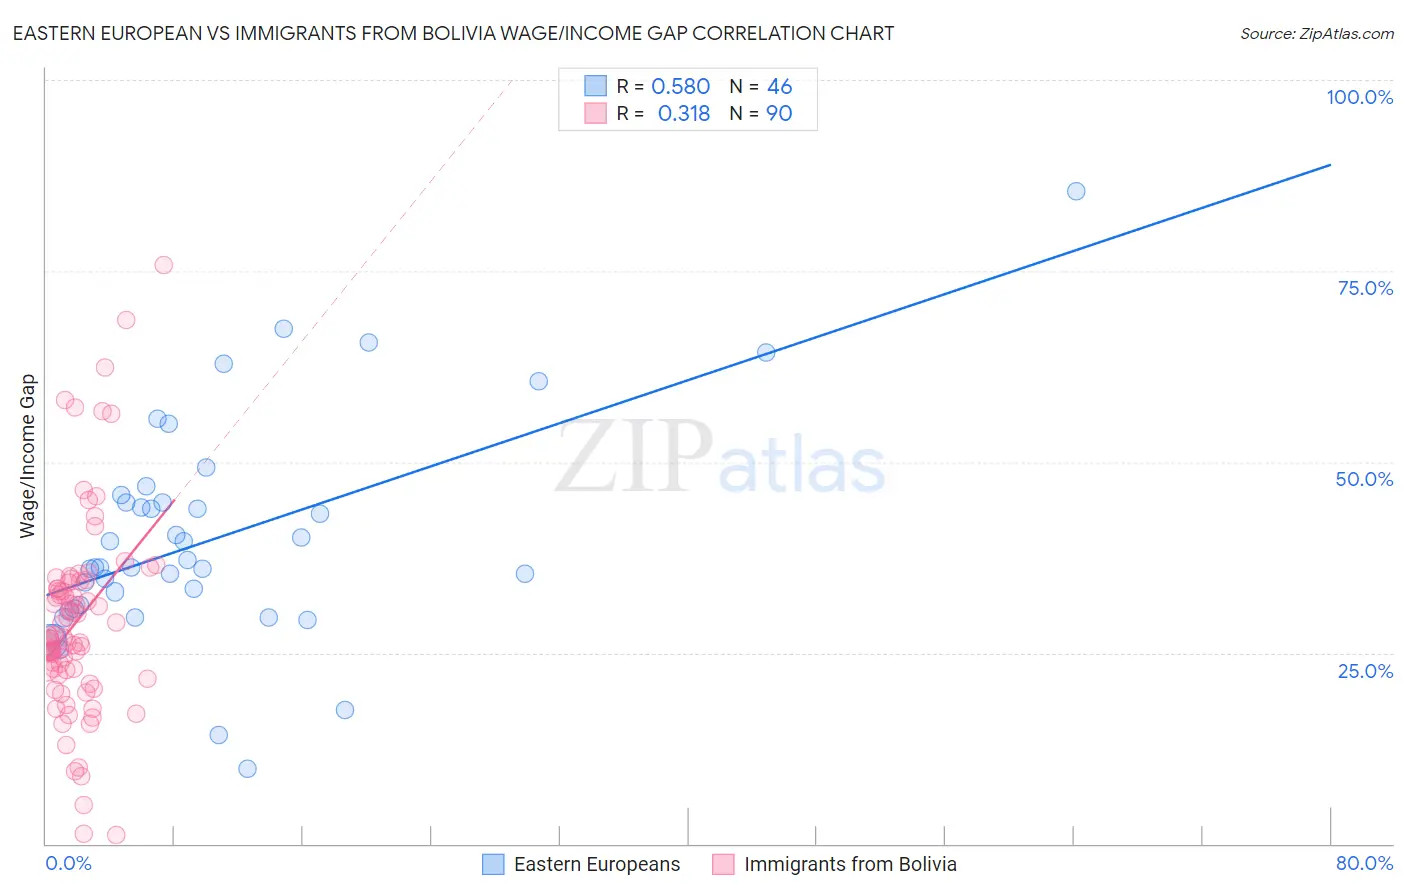
Eastern European vs Immigrants from Bolivia Wage/Income Gap Correlation Chart
The statistical analysis conducted on geographies consisting of 460,606,306 people shows a substantial positive correlation between the proportion of Eastern Europeans and wage/income gap percentage in the United States with a correlation coefficient (R) of 0.580 and weighted average of 28.6%. Similarly, the statistical analysis conducted on geographies consisting of 158,701,759 people shows a mild positive correlation between the proportion of Immigrants from Bolivia and wage/income gap percentage in the United States with a correlation coefficient (R) of 0.318 and weighted average of 26.0%, a difference of 10.2%.
Wage/Income Gap Correlation Summary
| Measurement | Eastern European | Immigrants from Bolivia |
| Minimum | 9.9% | 1.1% |
| Maximum | 85.4% | 75.7% |
| Range | 75.6% | 74.6% |
| Mean | 39.9% | 29.2% |
| Median | 36.2% | 26.9% |
| Interquartile 25% (IQ1) | 30.7% | 22.8% |
| Interquartile 75% (IQ3) | 44.6% | 34.2% |
| Interquartile Range (IQR) | 13.9% | 11.5% |
| Standard Deviation (Sample) | 14.4% | 13.1% |
| Standard Deviation (Population) | 14.3% | 13.1% |
Similar Demographics by Wage/Income Gap
Demographics Similar to Eastern Europeans by Wage/Income Gap
In terms of wage/income gap, the demographic groups most similar to Eastern Europeans are Immigrants from Lithuania (28.6%, a difference of 0.13%), French (28.7%, a difference of 0.13%), Finnish (28.6%, a difference of 0.20%), Immigrants from Scotland (28.7%, a difference of 0.27%), and Macedonian (28.6%, a difference of 0.29%).
| Demographics | Rating | Rank | Wage/Income Gap |
| Immigrants | South Africa | 0.1 /100 | #305 | Tragic 28.5% |
| Whites/Caucasians | 0.1 /100 | #306 | Tragic 28.5% |
| Immigrants | Denmark | 0.1 /100 | #307 | Tragic 28.5% |
| Poles | 0.1 /100 | #308 | Tragic 28.5% |
| Macedonians | 0.1 /100 | #309 | Tragic 28.6% |
| Finns | 0.1 /100 | #310 | Tragic 28.6% |
| Immigrants | Lithuania | 0.1 /100 | #311 | Tragic 28.6% |
| Eastern Europeans | 0.1 /100 | #312 | Tragic 28.6% |
| French | 0.1 /100 | #313 | Tragic 28.7% |
| Immigrants | Scotland | 0.1 /100 | #314 | Tragic 28.7% |
| Maltese | 0.1 /100 | #315 | Tragic 28.7% |
| Lithuanians | 0.1 /100 | #316 | Tragic 28.7% |
| Belgians | 0.1 /100 | #317 | Tragic 28.8% |
| Basques | 0.1 /100 | #318 | Tragic 28.8% |
| Slovaks | 0.1 /100 | #319 | Tragic 28.9% |
Demographics Similar to Immigrants from Bolivia by Wage/Income Gap
In terms of wage/income gap, the demographic groups most similar to Immigrants from Bolivia are Immigrants from Serbia (26.0%, a difference of 0.070%), Immigrants from Kazakhstan (26.0%, a difference of 0.090%), Guamanian/Chamorro (26.0%, a difference of 0.11%), Mexican (26.0%, a difference of 0.14%), and Samoan (26.0%, a difference of 0.15%).
| Demographics | Rating | Rank | Wage/Income Gap |
| Alaskan Athabascans | 50.0 /100 | #174 | Average 25.8% |
| Sri Lankans | 47.0 /100 | #175 | Average 25.8% |
| Paraguayans | 46.7 /100 | #176 | Average 25.8% |
| Cambodians | 45.1 /100 | #177 | Average 25.8% |
| Chinese | 42.0 /100 | #178 | Average 25.9% |
| Samoans | 38.6 /100 | #179 | Fair 26.0% |
| Guamanians/Chamorros | 38.0 /100 | #180 | Fair 26.0% |
| Immigrants | Bolivia | 36.4 /100 | #181 | Fair 26.0% |
| Immigrants | Serbia | 35.4 /100 | #182 | Fair 26.0% |
| Immigrants | Kazakhstan | 35.2 /100 | #183 | Fair 26.0% |
| Mexicans | 34.4 /100 | #184 | Fair 26.0% |
| Pakistanis | 33.7 /100 | #185 | Fair 26.1% |
| Immigrants | Indonesia | 32.5 /100 | #186 | Fair 26.1% |
| Palestinians | 29.9 /100 | #187 | Fair 26.1% |
| Immigrants | Egypt | 29.9 /100 | #188 | Fair 26.1% |