African vs Immigrants from Kuwait Householder Income Under 25 years
COMPARE
African
Immigrants from Kuwait
Householder Income Under 25 years
Householder Income Under 25 years Comparison
Africans
Immigrants from Kuwait
$46,838
HOUSEHOLDER INCOME UNDER 25 YEARS
0.0/ 100
METRIC RATING
319th/ 347
METRIC RANK
$48,126
HOUSEHOLDER INCOME UNDER 25 YEARS
0.0/ 100
METRIC RATING
301st/ 347
METRIC RANK
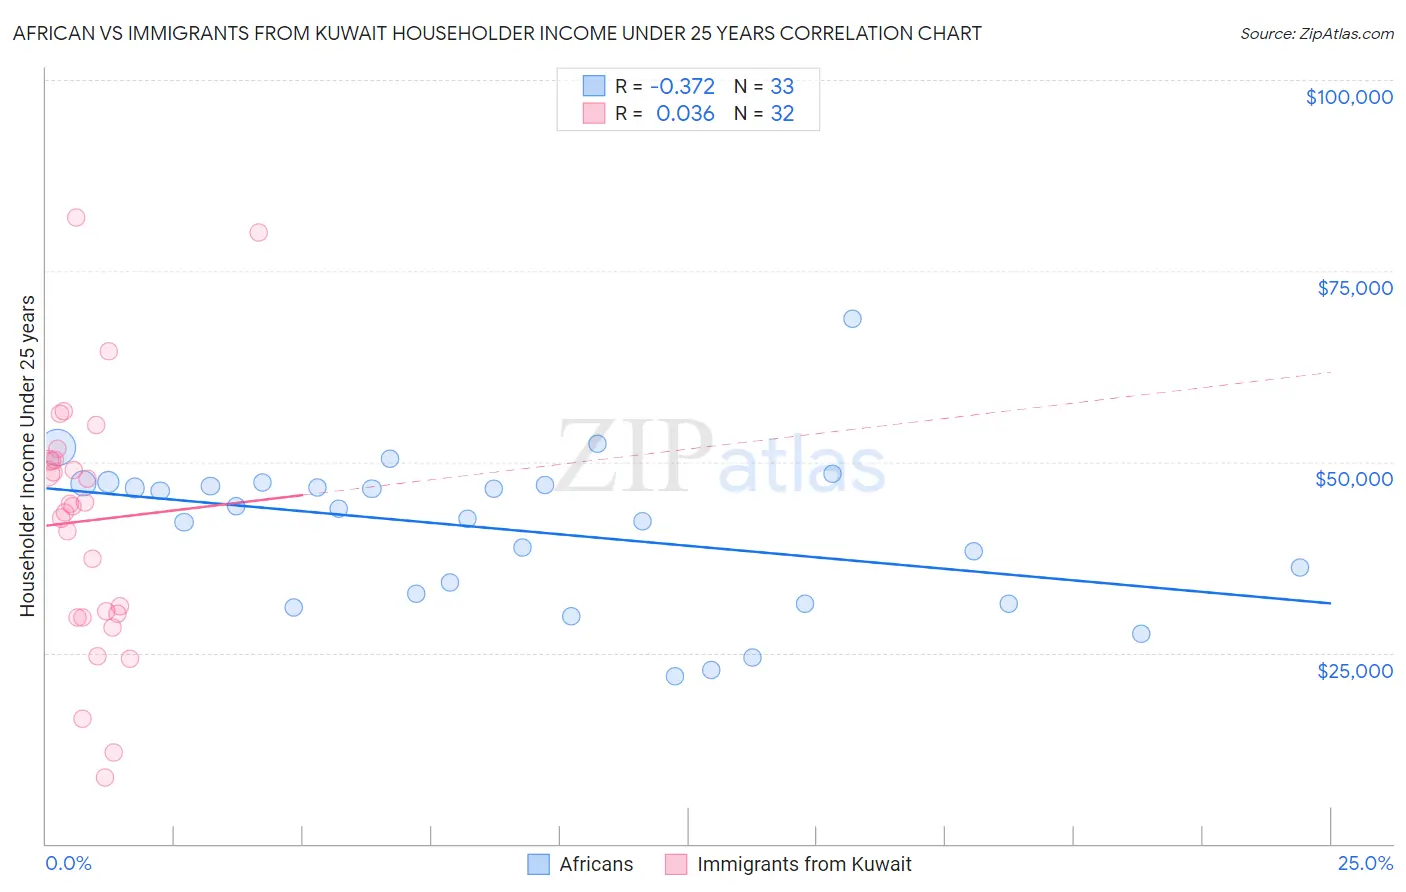
African vs Immigrants from Kuwait Householder Income Under 25 years Correlation Chart
The statistical analysis conducted on geographies consisting of 392,403,445 people shows a mild negative correlation between the proportion of Africans and household income with householder under the age of 25 in the United States with a correlation coefficient (R) of -0.372 and weighted average of $46,838. Similarly, the statistical analysis conducted on geographies consisting of 126,358,958 people shows no correlation between the proportion of Immigrants from Kuwait and household income with householder under the age of 25 in the United States with a correlation coefficient (R) of 0.036 and weighted average of $48,126, a difference of 2.8%.
Householder Income Under 25 years Correlation Summary
| Measurement | African | Immigrants from Kuwait |
| Minimum | $21,932 | $8,680 |
| Maximum | $68,731 | $81,978 |
| Range | $46,799 | $73,298 |
| Mean | $41,066 | $42,291 |
| Median | $43,851 | $44,394 |
| Interquartile 25% (IQ1) | $32,121 | $29,899 |
| Interquartile 75% (IQ3) | $47,071 | $50,227 |
| Interquartile Range (IQR) | $14,950 | $20,328 |
| Standard Deviation (Sample) | $10,046 | $16,858 |
| Standard Deviation (Population) | $9,893 | $16,592 |
Demographics Similar to Africans and Immigrants from Kuwait by Householder Income Under 25 years
In terms of householder income under 25 years, the demographic groups most similar to Africans are Immigrants from Sudan ($46,791, a difference of 0.10%), Spanish American ($46,913, a difference of 0.16%), Hopi ($46,978, a difference of 0.30%), Sudanese ($46,982, a difference of 0.31%), and Crow ($47,012, a difference of 0.37%). Similarly, the demographic groups most similar to Immigrants from Kuwait are Immigrants from Somalia ($48,135, a difference of 0.020%), Immigrants from Liberia ($47,981, a difference of 0.30%), Immigrants from Middle Africa ($47,916, a difference of 0.44%), Menominee ($47,907, a difference of 0.46%), and Cherokee ($47,848, a difference of 0.58%).
| Demographics | Rating | Rank | Householder Income Under 25 years |
| Immigrants | Somalia | 0.0 /100 | #300 | Tragic $48,135 |
| Immigrants | Kuwait | 0.0 /100 | #301 | Tragic $48,126 |
| Immigrants | Liberia | 0.0 /100 | #302 | Tragic $47,981 |
| Immigrants | Middle Africa | 0.0 /100 | #303 | Tragic $47,916 |
| Menominee | 0.0 /100 | #304 | Tragic $47,907 |
| Cherokee | 0.0 /100 | #305 | Tragic $47,848 |
| Natives/Alaskans | 0.0 /100 | #306 | Tragic $47,704 |
| Bangladeshis | 0.0 /100 | #307 | Tragic $47,589 |
| Comanche | 0.0 /100 | #308 | Tragic $47,518 |
| U.S. Virgin Islanders | 0.0 /100 | #309 | Tragic $47,448 |
| Iroquois | 0.0 /100 | #310 | Tragic $47,380 |
| Ottawa | 0.0 /100 | #311 | Tragic $47,366 |
| Bermudans | 0.0 /100 | #312 | Tragic $47,359 |
| Delaware | 0.0 /100 | #313 | Tragic $47,159 |
| Chippewa | 0.0 /100 | #314 | Tragic $47,015 |
| Crow | 0.0 /100 | #315 | Tragic $47,012 |
| Sudanese | 0.0 /100 | #316 | Tragic $46,982 |
| Hopi | 0.0 /100 | #317 | Tragic $46,978 |
| Spanish Americans | 0.0 /100 | #318 | Tragic $46,913 |
| Africans | 0.0 /100 | #319 | Tragic $46,838 |
| Immigrants | Sudan | 0.0 /100 | #320 | Tragic $46,791 |