Immigrants from Central America vs German Median Female Earnings
COMPARE
Immigrants from Central America
German
Median Female Earnings
Median Female Earnings Comparison
Immigrants from Central America
Germans
$33,953
MEDIAN FEMALE EARNINGS
0.0/ 100
METRIC RATING
328th/ 347
METRIC RANK
$37,986
MEDIAN FEMALE EARNINGS
2.8/ 100
METRIC RATING
243rd/ 347
METRIC RANK
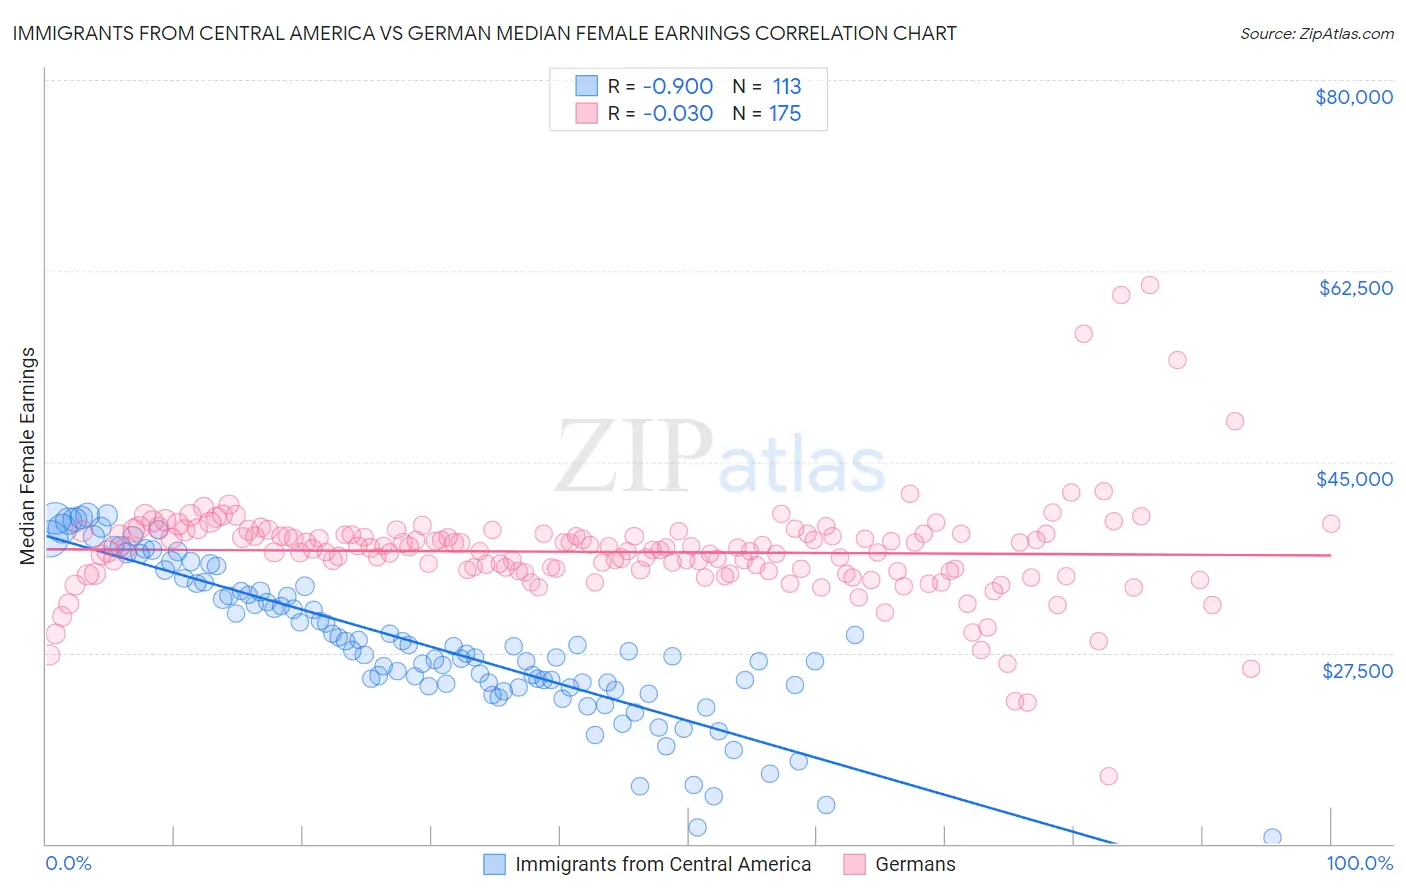
Immigrants from Central America vs German Median Female Earnings Correlation Chart
The statistical analysis conducted on geographies consisting of 535,445,485 people shows a near-perfect negative correlation between the proportion of Immigrants from Central America and median female earnings in the United States with a correlation coefficient (R) of -0.900 and weighted average of $33,953. Similarly, the statistical analysis conducted on geographies consisting of 578,410,378 people shows no correlation between the proportion of Germans and median female earnings in the United States with a correlation coefficient (R) of -0.030 and weighted average of $37,986, a difference of 11.9%.
Median Female Earnings Correlation Summary
| Measurement | Immigrants from Central America | German |
| Minimum | $10,532 | $16,161 |
| Maximum | $40,138 | $61,250 |
| Range | $29,606 | $45,089 |
| Mean | $28,383 | $36,748 |
| Median | $27,631 | $36,985 |
| Interquartile 25% (IQ1) | $24,472 | $34,926 |
| Interquartile 75% (IQ3) | $33,368 | $38,384 |
| Interquartile Range (IQR) | $8,895 | $3,458 |
| Standard Deviation (Sample) | $6,771 | $4,922 |
| Standard Deviation (Population) | $6,741 | $4,908 |
Similar Demographics by Median Female Earnings
Demographics Similar to Immigrants from Central America by Median Female Earnings
In terms of median female earnings, the demographic groups most similar to Immigrants from Central America are Hopi ($33,932, a difference of 0.060%), Menominee ($33,894, a difference of 0.17%), Cajun ($34,034, a difference of 0.24%), Kiowa ($34,074, a difference of 0.36%), and Native/Alaskan ($33,806, a difference of 0.43%).
| Demographics | Rating | Rank | Median Female Earnings |
| Hispanics or Latinos | 0.0 /100 | #321 | Tragic $34,421 |
| Chickasaw | 0.0 /100 | #322 | Tragic $34,414 |
| Seminole | 0.0 /100 | #323 | Tragic $34,385 |
| Immigrants | Congo | 0.0 /100 | #324 | Tragic $34,317 |
| Dutch West Indians | 0.0 /100 | #325 | Tragic $34,106 |
| Kiowa | 0.0 /100 | #326 | Tragic $34,074 |
| Cajuns | 0.0 /100 | #327 | Tragic $34,034 |
| Immigrants | Central America | 0.0 /100 | #328 | Tragic $33,953 |
| Hopi | 0.0 /100 | #329 | Tragic $33,932 |
| Menominee | 0.0 /100 | #330 | Tragic $33,894 |
| Natives/Alaskans | 0.0 /100 | #331 | Tragic $33,806 |
| Choctaw | 0.0 /100 | #332 | Tragic $33,775 |
| Mexicans | 0.0 /100 | #333 | Tragic $33,664 |
| Spanish American Indians | 0.0 /100 | #334 | Tragic $33,625 |
| Creek | 0.0 /100 | #335 | Tragic $33,437 |
Demographics Similar to Germans by Median Female Earnings
In terms of median female earnings, the demographic groups most similar to Germans are Immigrants from Liberia ($37,970, a difference of 0.040%), Immigrants from Middle Africa ($37,965, a difference of 0.050%), Delaware ($37,964, a difference of 0.060%), Immigrants from Burma/Myanmar ($38,028, a difference of 0.11%), and Immigrants from Somalia ($37,914, a difference of 0.19%).
| Demographics | Rating | Rank | Median Female Earnings |
| Liberians | 4.4 /100 | #236 | Tragic $38,215 |
| Immigrants | Cabo Verde | 4.3 /100 | #237 | Tragic $38,208 |
| Alaska Natives | 4.3 /100 | #238 | Tragic $38,202 |
| English | 4.2 /100 | #239 | Tragic $38,196 |
| Finns | 4.0 /100 | #240 | Tragic $38,173 |
| Spanish | 3.5 /100 | #241 | Tragic $38,098 |
| Immigrants | Burma/Myanmar | 3.0 /100 | #242 | Tragic $38,028 |
| Germans | 2.8 /100 | #243 | Tragic $37,986 |
| Immigrants | Liberia | 2.7 /100 | #244 | Tragic $37,970 |
| Immigrants | Middle Africa | 2.7 /100 | #245 | Tragic $37,965 |
| Delaware | 2.6 /100 | #246 | Tragic $37,964 |
| Immigrants | Somalia | 2.4 /100 | #247 | Tragic $37,914 |
| Alaskan Athabascans | 2.3 /100 | #248 | Tragic $37,905 |
| Swiss | 2.3 /100 | #249 | Tragic $37,904 |
| Immigrants | Iraq | 2.2 /100 | #250 | Tragic $37,864 |