African vs German Average Family Size
COMPARE
African
German
Average Family Size
Average Family Size Comparison
Africans
Germans
3.25
AVERAGE FAMILY SIZE
84.9/ 100
METRIC RATING
134th/ 347
METRIC RANK
3.09
AVERAGE FAMILY SIZE
0.0/ 100
METRIC RATING
342nd/ 347
METRIC RANK
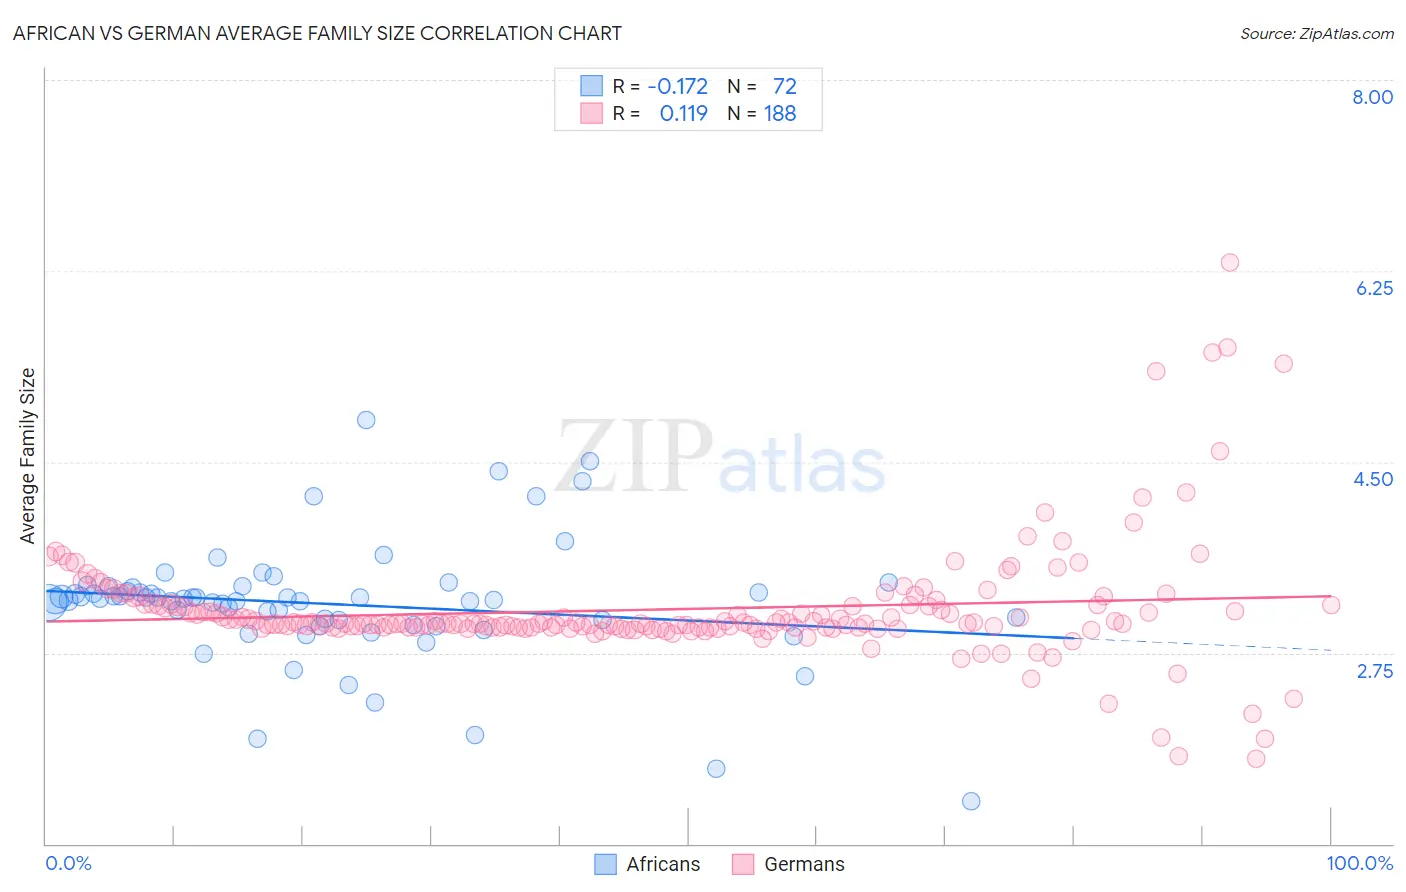
African vs German Average Family Size Correlation Chart
The statistical analysis conducted on geographies consisting of 469,598,302 people shows a poor negative correlation between the proportion of Africans and average family size in the United States with a correlation coefficient (R) of -0.172 and weighted average of 3.25. Similarly, the statistical analysis conducted on geographies consisting of 580,609,080 people shows a poor positive correlation between the proportion of Germans and average family size in the United States with a correlation coefficient (R) of 0.119 and weighted average of 3.09, a difference of 5.3%.
Average Family Size Correlation Summary
| Measurement | African | German |
| Minimum | 1.39 | 1.78 |
| Maximum | 4.88 | 6.33 |
| Range | 3.49 | 4.55 |
| Mean | 3.20 | 3.15 |
| Median | 3.24 | 3.02 |
| Interquartile 25% (IQ1) | 3.02 | 2.98 |
| Interquartile 75% (IQ3) | 3.33 | 3.18 |
| Interquartile Range (IQR) | 0.31 | 0.20 |
| Standard Deviation (Sample) | 0.56 | 0.54 |
| Standard Deviation (Population) | 0.55 | 0.54 |
Similar Demographics by Average Family Size
Demographics Similar to Africans by Average Family Size
In terms of average family size, the demographic groups most similar to Africans are Panamanian (3.25, a difference of 0.020%), Immigrants from Venezuela (3.26, a difference of 0.050%), Costa Rican (3.26, a difference of 0.070%), Comanche (3.25, a difference of 0.070%), and Immigrants from Middle Africa (3.25, a difference of 0.080%).
| Demographics | Rating | Rank | Average Family Size |
| Immigrants | Syria | 90.6 /100 | #127 | Exceptional 3.26 |
| Colombians | 89.9 /100 | #128 | Excellent 3.26 |
| Immigrants | Hong Kong | 88.6 /100 | #129 | Excellent 3.26 |
| Laotians | 88.5 /100 | #130 | Excellent 3.26 |
| Immigrants | Western Asia | 87.7 /100 | #131 | Excellent 3.26 |
| Costa Ricans | 86.8 /100 | #132 | Excellent 3.26 |
| Immigrants | Venezuela | 86.3 /100 | #133 | Excellent 3.26 |
| Africans | 84.9 /100 | #134 | Excellent 3.25 |
| Panamanians | 84.2 /100 | #135 | Excellent 3.25 |
| Comanche | 82.8 /100 | #136 | Excellent 3.25 |
| Immigrants | Middle Africa | 82.4 /100 | #137 | Excellent 3.25 |
| Cubans | 81.8 /100 | #138 | Excellent 3.25 |
| Immigrants | Ethiopia | 81.6 /100 | #139 | Excellent 3.25 |
| Sub-Saharan Africans | 81.6 /100 | #140 | Excellent 3.25 |
| Venezuelans | 81.4 /100 | #141 | Excellent 3.25 |
Demographics Similar to Germans by Average Family Size
In terms of average family size, the demographic groups most similar to Germans are Polish (3.09, a difference of 0.14%), Finnish (3.09, a difference of 0.19%), Norwegian (3.08, a difference of 0.23%), Croatian (3.10, a difference of 0.33%), and French (3.10, a difference of 0.34%).
| Demographics | Rating | Rank | Average Family Size |
| Estonians | 0.0 /100 | #333 | Tragic 3.10 |
| Lithuanians | 0.0 /100 | #334 | Tragic 3.10 |
| Luxembourgers | 0.0 /100 | #335 | Tragic 3.10 |
| Irish | 0.0 /100 | #336 | Tragic 3.10 |
| Swedes | 0.0 /100 | #337 | Tragic 3.10 |
| French | 0.0 /100 | #338 | Tragic 3.10 |
| Croatians | 0.0 /100 | #339 | Tragic 3.10 |
| Finns | 0.0 /100 | #340 | Tragic 3.09 |
| Poles | 0.0 /100 | #341 | Tragic 3.09 |
| Germans | 0.0 /100 | #342 | Tragic 3.09 |
| Norwegians | 0.0 /100 | #343 | Tragic 3.08 |
| French Canadians | 0.0 /100 | #344 | Tragic 3.07 |
| Slovenes | 0.0 /100 | #345 | Tragic 3.07 |
| Slovaks | 0.0 /100 | #346 | Tragic 3.06 |
| Carpatho Rusyns | 0.0 /100 | #347 | Tragic 3.06 |