Hungarian vs Eastern European Median Female Earnings
COMPARE
Hungarian
Eastern European
Median Female Earnings
Median Female Earnings Comparison
Hungarians
Eastern Europeans
$39,510
MEDIAN FEMALE EARNINGS
40.3/ 100
METRIC RATING
183rd/ 347
METRIC RANK
$45,385
MEDIAN FEMALE EARNINGS
100.0/ 100
METRIC RATING
19th/ 347
METRIC RANK
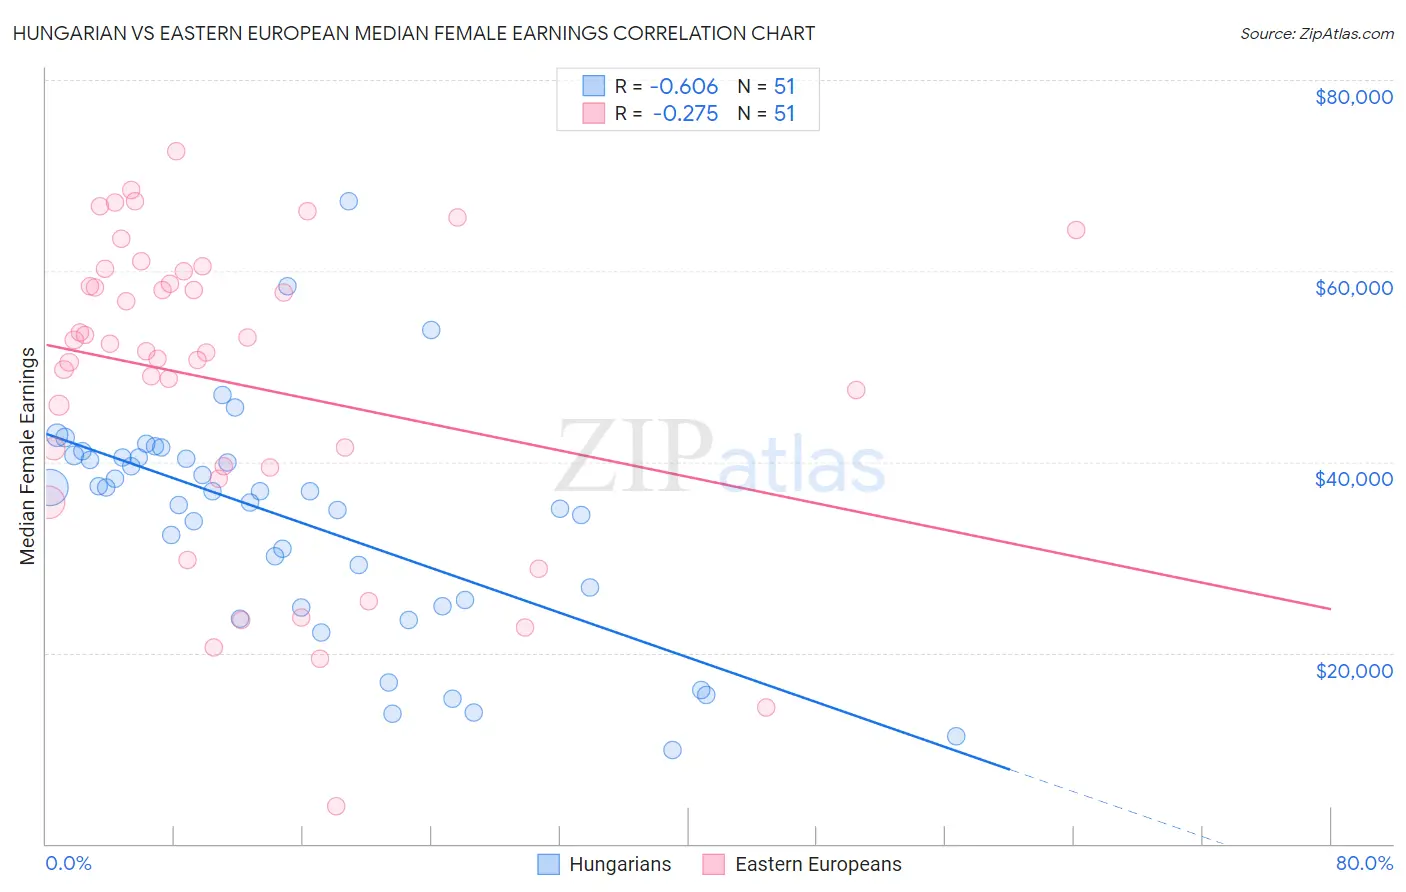
Hungarian vs Eastern European Median Female Earnings Correlation Chart
The statistical analysis conducted on geographies consisting of 485,733,652 people shows a significant negative correlation between the proportion of Hungarians and median female earnings in the United States with a correlation coefficient (R) of -0.606 and weighted average of $39,510. Similarly, the statistical analysis conducted on geographies consisting of 460,854,647 people shows a weak negative correlation between the proportion of Eastern Europeans and median female earnings in the United States with a correlation coefficient (R) of -0.275 and weighted average of $45,385, a difference of 14.9%.
Median Female Earnings Correlation Summary
| Measurement | Hungarian | Eastern European |
| Minimum | $9,845 | $3,984 |
| Maximum | $67,329 | $72,541 |
| Range | $57,484 | $68,557 |
| Mean | $33,736 | $48,179 |
| Median | $36,875 | $51,543 |
| Interquartile 25% (IQ1) | $24,845 | $39,388 |
| Interquartile 75% (IQ3) | $40,519 | $59,979 |
| Interquartile Range (IQR) | $15,674 | $20,591 |
| Standard Deviation (Sample) | $11,915 | $16,076 |
| Standard Deviation (Population) | $11,798 | $15,918 |
Similar Demographics by Median Female Earnings
Demographics Similar to Hungarians by Median Female Earnings
In terms of median female earnings, the demographic groups most similar to Hungarians are Tlingit-Haida ($39,513, a difference of 0.010%), Tsimshian ($39,530, a difference of 0.050%), Immigrants from Kenya ($39,535, a difference of 0.060%), European ($39,457, a difference of 0.13%), and Immigrants from West Indies ($39,441, a difference of 0.18%).
| Demographics | Rating | Rank | Median Female Earnings |
| Nigerians | 47.0 /100 | #176 | Average $39,641 |
| Costa Ricans | 46.1 /100 | #177 | Average $39,622 |
| Slavs | 45.6 /100 | #178 | Average $39,613 |
| Immigrants | Germany | 45.1 /100 | #179 | Average $39,603 |
| Immigrants | Kenya | 41.6 /100 | #180 | Average $39,535 |
| Tsimshian | 41.4 /100 | #181 | Average $39,530 |
| Tlingit-Haida | 40.5 /100 | #182 | Average $39,513 |
| Hungarians | 40.3 /100 | #183 | Average $39,510 |
| Europeans | 37.7 /100 | #184 | Fair $39,457 |
| Immigrants | West Indies | 36.9 /100 | #185 | Fair $39,441 |
| Colombians | 36.9 /100 | #186 | Fair $39,439 |
| Swedes | 36.0 /100 | #187 | Fair $39,421 |
| Bermudans | 35.9 /100 | #188 | Fair $39,418 |
| Senegalese | 34.2 /100 | #189 | Fair $39,384 |
| Puget Sound Salish | 33.9 /100 | #190 | Fair $39,376 |
Demographics Similar to Eastern Europeans by Median Female Earnings
In terms of median female earnings, the demographic groups most similar to Eastern Europeans are Immigrants from Japan ($45,323, a difference of 0.14%), Cypriot ($45,570, a difference of 0.41%), Cambodian ($45,014, a difference of 0.82%), Immigrants from Greece ($44,976, a difference of 0.91%), and Burmese ($44,911, a difference of 1.1%).
| Demographics | Rating | Rank | Median Female Earnings |
| Immigrants | Israel | 100.0 /100 | #12 | Exceptional $46,902 |
| Immigrants | Australia | 100.0 /100 | #13 | Exceptional $46,573 |
| Soviet Union | 100.0 /100 | #14 | Exceptional $46,556 |
| Immigrants | Eastern Asia | 100.0 /100 | #15 | Exceptional $46,502 |
| Indians (Asian) | 100.0 /100 | #16 | Exceptional $46,481 |
| Immigrants | South Central Asia | 100.0 /100 | #17 | Exceptional $46,324 |
| Cypriots | 100.0 /100 | #18 | Exceptional $45,570 |
| Eastern Europeans | 100.0 /100 | #19 | Exceptional $45,385 |
| Immigrants | Japan | 100.0 /100 | #20 | Exceptional $45,323 |
| Cambodians | 100.0 /100 | #21 | Exceptional $45,014 |
| Immigrants | Greece | 100.0 /100 | #22 | Exceptional $44,976 |
| Burmese | 100.0 /100 | #23 | Exceptional $44,911 |
| Immigrants | Korea | 100.0 /100 | #24 | Exceptional $44,847 |
| Immigrants | Sweden | 100.0 /100 | #25 | Exceptional $44,774 |
| Immigrants | Belarus | 100.0 /100 | #26 | Exceptional $44,757 |